
The phrase data pipeline hides three different jobs. There is the wire that moves rows from system A to system B. There is the transformation that reshapes those rows into something a downstream consumer can use. And there is the observability layer that tells you when either of the first two is lying. Most teams have built the first two and skipped the third, which is why their dashboards drift and their attribution model is suddenly wrong on a Tuesday afternoon and nobody knows why.
This essay is a practitioner playbook for building data pipelines at operator scale, for a $5K to $25K monthly retainer client whose stack is some combination of Stripe, HubSpot, GA4, ad platforms, and a CRM that nobody wants to admit is the source of truth. That's a long way from Snowflake-and-Airflow-and-thirty-engineers scale, and from the FAANG case study where the pipeline ingests a billion events per minute. At operator scale the pipeline has to be reliable enough that the operator stops getting paged at midnight, simple enough that one person can maintain it, and observable enough that a silent drift in row counts is impossible to miss.
This essay is part of the Business Intelligence cluster on the wiki, and it applies the broader thesis of Intelligence Engineering to data engineering. Its methods pair with The Observability Manifesto, which gives the philosophical floor: if it is not in LogFire, it did not happen.
The four stages: source, transform, warehouse, model
Every pipeline has four stages, even when teams pretend it has fewer. Calling them by name tells you which stage broke when something goes wrong.
Source is where the row originates: a Stripe charge, a HubSpot deal stage change, a Facebook ad spend row, a GA4 session. Each source has its own schema, its own update cadence, and its own failure mode. Stripe sends a webhook. HubSpot exposes a REST API. Facebook exports a daily CSV with a 28-day attribution window that quietly back-fills. GA4 reports through BigQuery with a 24-to-72-hour delay. Each source is its own contract and its own clock. Pretending they all behave the same way is the most common pipeline mistake.
Transform is where shape and units get normalized. Currency gets converted to a single denomination, timezones get reconciled to UTC, customer IDs get joined across systems, and webhook retries get deduplicated. Pydantic V2 models serve as the intermediate representation: every transformed row becomes a typed object with explicit field validation, and the type is the contract every downstream stage trusts. The transform stage is also where business logic enters: a deal is closed-won when stage equals X and amount is greater than Y. That logic should live in code, version-controlled, with property-based tests around it. Spreadsheet logic in transform is technical debt with a bow on it.
Warehouse is where rows live, and at operator scale that means Postgres. Postgres can handle two hundred million rows on commodity hardware before performance gets interesting, and it has SQL, joins, window functions, partial indexes, and twenty years of operational maturity. Snowflake and BigQuery are the right answer when row counts cross billions or when concurrent analytical queries overwhelm a single Postgres instance, neither of which is true for the typical retainer engagement. The warehouse decision is downstream of row count and query pattern, not upstream of them.
Model is where the row becomes a number a human acts on. What was last quarter's CAC by acquisition channel? Which cohort has the highest LTV? How many qualified leads did we generate from paid social last month? The model layer is dbt or its equivalent: SQL that documents itself, tests for assumptions, and exposes named tables a dashboard query can hit without re-deriving anything. The model layer is where ad-hoc analysis goes to die, because every analyst on the team has been redoing the same join in their own way.
The observability plane that runs above all four stages
Observability is not a tab in your monitoring tool. It is a discipline that runs above the pipeline at every stage, and the rule is the project floor: if it is not in LogFire, it did not happen.
Spans on every I/O hop. Every API call, every database write, and every file read gets a span, a timed record of that one operation, with behavioral attributes (source name, row count, error class, retry depth). The span is what you query when something goes wrong. Show me every Stripe webhook ingest in the last 24 hours where rows ingested was zero is a query that takes ten seconds when spans exist and four hours when they don't.
Row-count assertions at every stage boundary. When transform consumes 1,000 source rows, it should produce some predictable count downstream. That count won't always be 1,000: it might be 950 after deduplication, or 1,500 when one source row fans out to many transformed rows. Either way, the relationship is known and asserted. If transform produces fewer than 80% or more than 200% of source row count, alert. The assertion catches silent data loss before it reaches a dashboard.
Schema-drift detection on source ingestion. When a vendor adds a column, removes a column, or changes a column's type, the pipeline should fail loudly, not silently route nulls through downstream tables. Pydantic catches this in transform; the source-side equivalent is a typed contract that fires an alert the first time the schema doesn't match expectations. Vendors will change schemas without notice. Build for that, not against it.
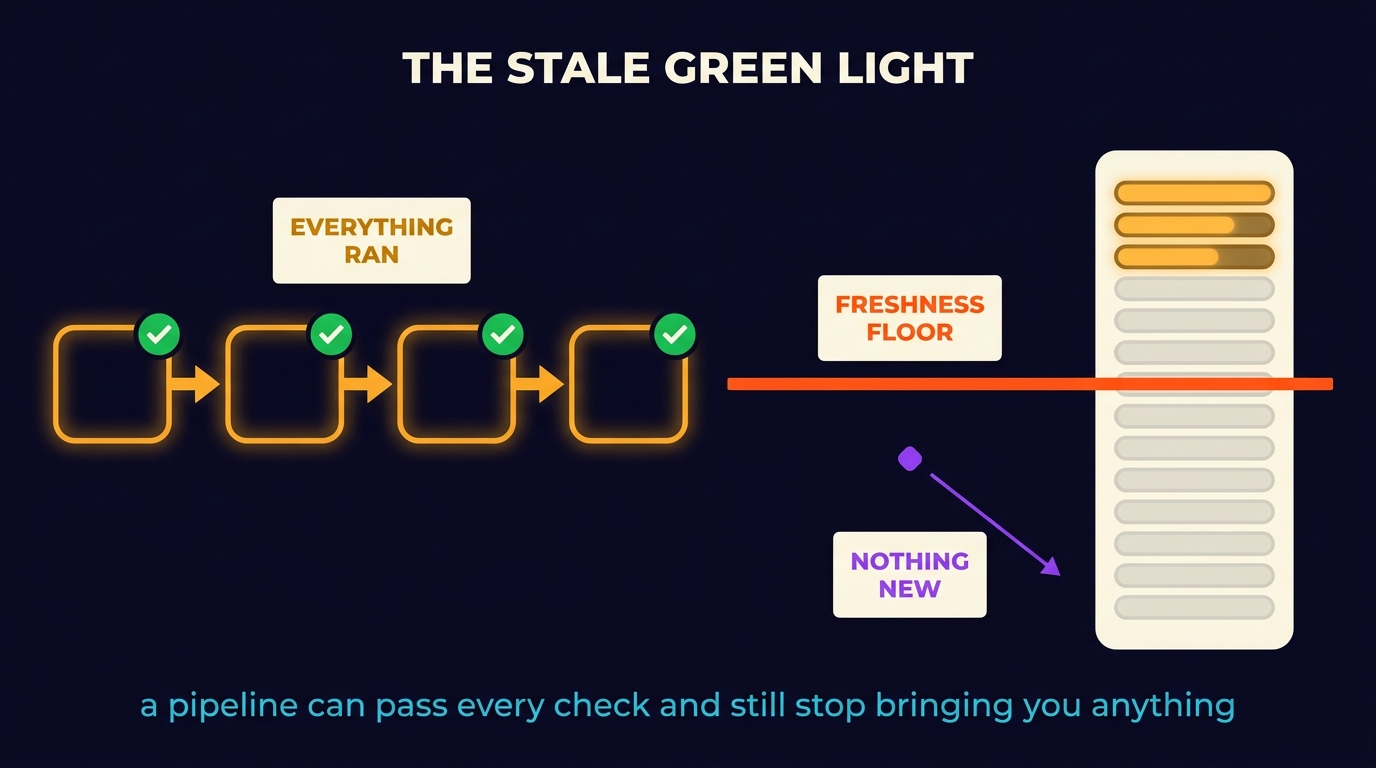
Alerts on freshness, not just breakage. A pipeline that runs every hour but silently stopped pulling new rows three days ago is the dangerous failure mode, because it doesn't look broken. Every dataset gets a freshness SLA: this table has rows from the last 60 minutes. If the most recent timestamp is older than the SLA, alert. Freshness alerts are how you catch the hardest class of pipeline bugs (empty pulls, paginated cursors stuck on the same page, expired API tokens) without staring at logs.
The Algorithmic Trading and Data Engineering case study (case study) is where this discipline was learned the hard way. In trading, a silent pipeline drift produces a wrong order, not just a wrong dashboard. The same observability rules apply at smaller stakes, and the only difference is how loud the alarm is when you skip them.
The three failure modes that look like success
The dangerous failures are the ones that don't look like failures, and three patterns dominate.
Silent fallback. The pipeline tries to fetch fresh data from source, fails, and falls back to cached or stale data. The downstream consumer never sees the failure, so the dashboard shows yesterday's numbers as today's. The CEO makes a decision on stale data and never knows why the next week's numbers are weird. The fix is structural: a fallback path must log a fallback span with severity warning or higher, and downstream consumers should refuse to render data that came through a fallback unless explicitly authorized. The rules I build by treat silent fallbacks that mask failures as the most dangerous pattern: log the fallback, alert on it, and never let a degraded path look like success.
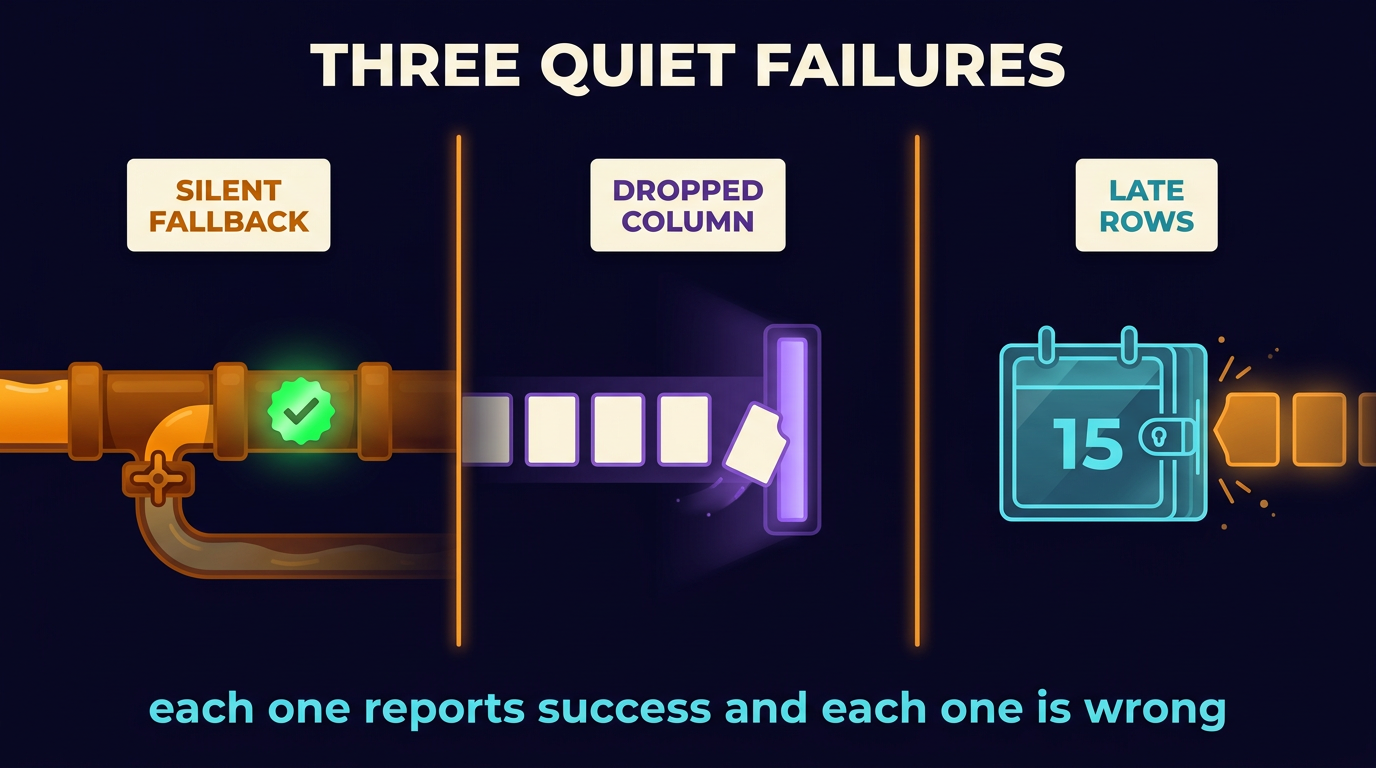
Schema drift swallowed. A vendor adds a new column, and the transform stage doesn't recognize it and drops it. The downstream model loses signal that was never noticed because nobody knew it was supposed to be there. The fix is the typed contract above. Pydantic V2 in strict mode rejects unknown fields by default. Make rejection the alert path, not the silent path.
Late-arriving rows. Most analytics queries close the day at midnight UTC. Some sources don't fully report a day's events until 48 to 72 hours later (Facebook's 28-day attribution window is the canonical example). If your pipeline closes Monday at midnight and Tuesday's report uses Monday's numbers, you're reporting a partial Monday and calling it complete. The fix is two reports: a fast preliminary report (day-of) and a finalized report run 72 hours later that overwrites the preliminary number. Each report says plainly what it is.
Stack decisions for the operator-scale build
The stack matters less than the instrumentation, but defaults exist.
Python with Pydantic V2 handles transform. As in the transform stage above, the Pydantic models are the intermediate representation, so every row in flight is a typed object and validation is automatic. Field descriptions carry behavioral context (who writes it, what consumes it, what cross-system implication it carries). When something breaks, the stack trace tells you exactly which field failed validation and why.
Postgres or DuckDB holds the warehouse. Postgres is the operational default, with the maturity, the tooling, and the operator availability. DuckDB is the right answer when the workload is analytical, embedded, or single-user (a research notebook, a CLI tool, a local dashboard). Both can be queried with the same SQL dialect, which means you can prototype in DuckDB and graduate to Postgres without rewriting analyses. Snowflake and BigQuery enter the conversation when row counts cross hundreds of millions, when concurrent analytical workloads exceed what one instance can serve, or when the operational team specifically needs cloud-native scaling. Below those thresholds, they're a tax.
dbt or its equivalent runs the model layer. dbt's contribution is the discipline of writing SQL that documents itself, testing assumptions inline, and producing a dependency graph (a DAG) that reads like a contract, not its templating. SQL Mesh covers the same territory and is sometimes better at incremental materialization. The choice matters less than committing to one and letting the model layer carry the business logic instead of spreading it across analyst notebooks.
LogFire handles observability, with spans on every I/O hop and behavioral attributes on every span, all queryable through the LogFire MCP for fast debugging. The Solar Portfolio Intelligence case study (case study) is the operational example: 50+ accounts, a centralized performance brain, and an observability layer that surfaced cross-account patterns the per-account view never could.
Case evidence
Three engagements anchor the discipline.
Algorithmic trading. Trading is the clearest case of a lesson learned the hard way: real-money decisions on real-time market data, where a silent latency drift or a quietly-dropped tick translates directly into financial loss. The work installed validation layers between every source and every model, plus a monitoring layer that surfaced both performance characteristics and failure modes before they became catastrophic. You earn the right to innovate by making the basics unbreakable. See Algorithmic Trading and Data Engineering.
Solar portfolio intelligence. One agency ran fifty-plus solar accounts, each previously treated as its own snowflake. The work centralized the performance data into a unified pipeline and built a lightweight portfolio brain that tracked offers, creatives, audiences, and funnel structures across contexts. Observability surfaced cross-account patterns that turned into playbooks for new account onboarding. The pipeline was the asset; the playbooks were the dividends. See Solar Portfolio Intelligence.
Forensic ad audits. Structural reads of ad-account history regularly recover 10 to 30 percent of spend. The pipeline pattern that supports this work is the same: pull the platform exports, normalize across campaigns and account structures, reconcile spend against revenue at the order or signup grain, surface the pattern. The audit is fast because the pipeline is reusable; the pipeline is reusable because the schema is enforced; the schema is enforced because Pydantic catches the drift the operator wouldn't. See Forensic Ad Audits.
Anti-patterns to avoid
Modern Data Stack cosplay. It means adopting Fivetran plus Snowflake plus dbt plus Looker plus Airflow plus Atlan plus Monte Carlo plus a vector store you can't name a use for. You end up with twelve tools, eight integration surfaces, and no observability discipline. Reliability comes from the discipline, not the tooling, and the discipline can run on Postgres and Python if the operator is realistic about scale.
Spreadsheet logic in transform. Business logic that lives only in a Google Sheet one analyst maintains is a single point of failure with extra steps, not a pipeline. The first thing to migrate when you take over a stack is the off-the-record sheet. Make it code. Make it tested. Make it owned.
Skipping the freshness SLA. Most teams alert on errors and ignore freshness. A pipeline that's silently stale for a week is a disaster waiting to happen. Add freshness SLAs to every dataset that anyone makes a decision on. Make staleness an alertable state, not an undetected one.
Building for scale you do not have yet. A pipeline designed for ten million events per minute is operationally heavier than one designed for ten thousand. Most operators have ten thousand. Build for the scale you have, with observability that lets you see when the scale changes, and refactor when the change is real instead of speculative.
Where to start
There are three starting points, in order of difficulty.
Easiest, do today. Instrument your existing pipeline with LogFire spans on every I/O hop: source pulls, transform writes, warehouse loads, and model materializations. Put behavioral attributes on each span (source name, row count, run duration). Within a week of running, you'll know which stage is your real bottleneck instead of the one you assumed it was.
Medium, this week. Add row-count assertions at every stage boundary and freshness SLAs on every dataset. The assertions catch silent data loss; the SLAs catch silent staleness. Both produce alerts you can route to email or Slack with five lines of code. The first time the assertions fire, you'll find a silent failure that has been corrupting reports for weeks.
Hardest, this month. Rebuild the transform layer with Pydantic V2 as the contract. Every row in flight is a typed model. Every field carries a description that names who writes it and what consumes it. Schema drift becomes a validation error, not a silent null. Business logic moves from spreadsheets and ad-hoc scripts into typed transforms with property-based tests around them (Hypothesis, in Python). The pipeline goes from it works most of the time to it tells me when it doesn't work, fast.
A pipeline that runs isn't the same as a pipeline you can trust, and observability is the difference. Every stage is a contract. Every contract has assertions. Every assertion fails loudly. A reliable pipeline is silent when healthy and unmissable when it lies. For the broader observability philosophy, see The Observability Manifesto. For how the warehouse output gets shaped into decisions, see Three Numbers That Decide.