
Last-click attribution is the dominant model in marketing because it's the easiest to compute, not because it's the most accurate. The model works like this: whichever channel touched the user immediately before they purchased gets the credit. Branded search, the channel that catches the user typing your company name into Google after they already decided, gets credited for the sale. Display, retargeting, the email reminder that closed the loop, all collect medals for the buyer's last step toward the door. The Facebook ad that introduced them three weeks ago gets nothing.
The math feels clean, and it's wrong. The user who searched your brand name was already going to buy, because something upstream had already moved them. Last-click rewards the channel that caught the buyer at the finish line and ignores every channel that ran the rest of the race. Operators who optimize against last-click systematically over-fund the bottom of the funnel and starve the top, which is how brands accidentally cap their growth.
Moving past last-click takes three things: knowing what multi-touch attribution is, knowing why incrementality testing alone answers the did the campaign work? question, and building a defensible attribution stack at operator scale without buying a $200K-per-year platform. This guide belongs with the other Business Intelligence entries, downstream of the data engineering covered in Source to Model, Observed and the dashboard discipline in Three Numbers That Decide.
Why last-click lies and what it costs
Last-click lies in three specific ways.
It rewards the closer, not the cause. The user types your brand name into Google because they remember you. The memory came from somewhere, and that somewhere doesn't get credit. Branded search return on ad spend (ROAS) looks like 8x and the operator pours more budget into branded search, but the lift from doing so is near zero, because the people typing your brand name are already inbound.
It punishes long consideration cycles. A B2B SaaS sale takes three months from awareness to purchase. The first touch is a podcast mention, the second a webinar attendance, the third a colleague's recommendation, and the fourth a comparison-page search. The user finally clicks a Google ad on the way to the purchase. Last-click hands the entire deal to Google Ads. The podcast, the webinar, and the recommendation all show as zero ROAS. The next budget cycle, the operator cuts the things that moved the buyer and triples down on the closer, and the pipeline mysteriously dries up six months later.
It can't tell the difference between a good campaign and a campaign that ran during a good week. If your Black Friday email arrives the same week as a positive industry event that would have lifted demand anyway, last-click credits the email for revenue that would have shown up regardless. The campaign looks great, and repeating it next year produces nothing because the underlying lift was never there.
Forensic ad audits surface this pattern repeatedly: 10 to 30 percent of ad spend across audited accounts is redistributable because the last-click numbers were systematically misleading the operator about which channels actually drove incremental revenue. See Forensic Ad Audits for the engagement pattern.
Multi-touch attribution: what it actually is
Multi-touch attribution (MTA) distributes credit across the touchpoints in a buyer's journey, and several rules-based models exist.
Linear assigns equal credit to every touch. If the journey had four touches, each gets 25 percent of the credit. Linear is the simplest improvement over last-click and surfaces upper-funnel work that last-click hides.
Time-decay weights recent touches more than older ones. Touches closer to the conversion get more credit, but the upstream touches still receive a meaningful share. Time-decay is a reasonable default for most ecommerce and short-cycle B2B.
Position-based (often called U-shaped) gives 40 percent to the first touch, 40 percent to the last touch, and distributes the remaining 20 percent across the middle. The split rewards discovery and conversion explicitly, and it works for products where awareness and closing both matter and you can't separate which is more important.
Data-driven attribution (Markov chains, Shapley values) computes credit based on the actual contribution of each touchpoint to conversions across the dataset. Markov models calculate the probability of conversion paths with and without specific channels and assign credit based on the difference. Shapley values are derived from cooperative game theory and distribute credit as if each channel were a player in a coalition. Both are mathematically more rigorous than rules-based models and both require enough conversion volume to be statistically meaningful (typically 1,000+ conversions per month before the model stabilizes).
All of these are improvements over last-click, and none of them solve the core problem: they all assume the touches in the data caused the conversion. That assumption is wrong. The user who clicked an ad and then bought might have bought without the ad. Multi-touch attribution improves the bookkeeping but doesn't answer the only question that matters, which is the counterfactual question: what would have happened anyway?
Incrementality: the only honest answer
Incrementality testing is the only method that answers the counterfactual question directly. The structure is simple even when the execution is hard. You construct a comparison group that doesn't see the campaign and measure the difference in outcomes between the group that sees it and the group that doesn't. The difference is the campaign's actual contribution. Everything else is bookkeeping.
Three practical methods dominate at operator scale.
The first is geo-holdouts. Run the campaign in some geographies and not others, controlling for population, baseline demand, and seasonality. Compare conversion rates between the run-geos and the holdout-geos. The lift is the incremental contribution. Geo-holdouts work for any campaign that can be regionally scoped (most paid social, most paid search outside of branded terms, most local services). The math runs cleanly when the geographies are similar in demand profile and the holdout window is long enough to overcome noise (typically 4 to 8 weeks for ecommerce, 8 to 12 for B2B).
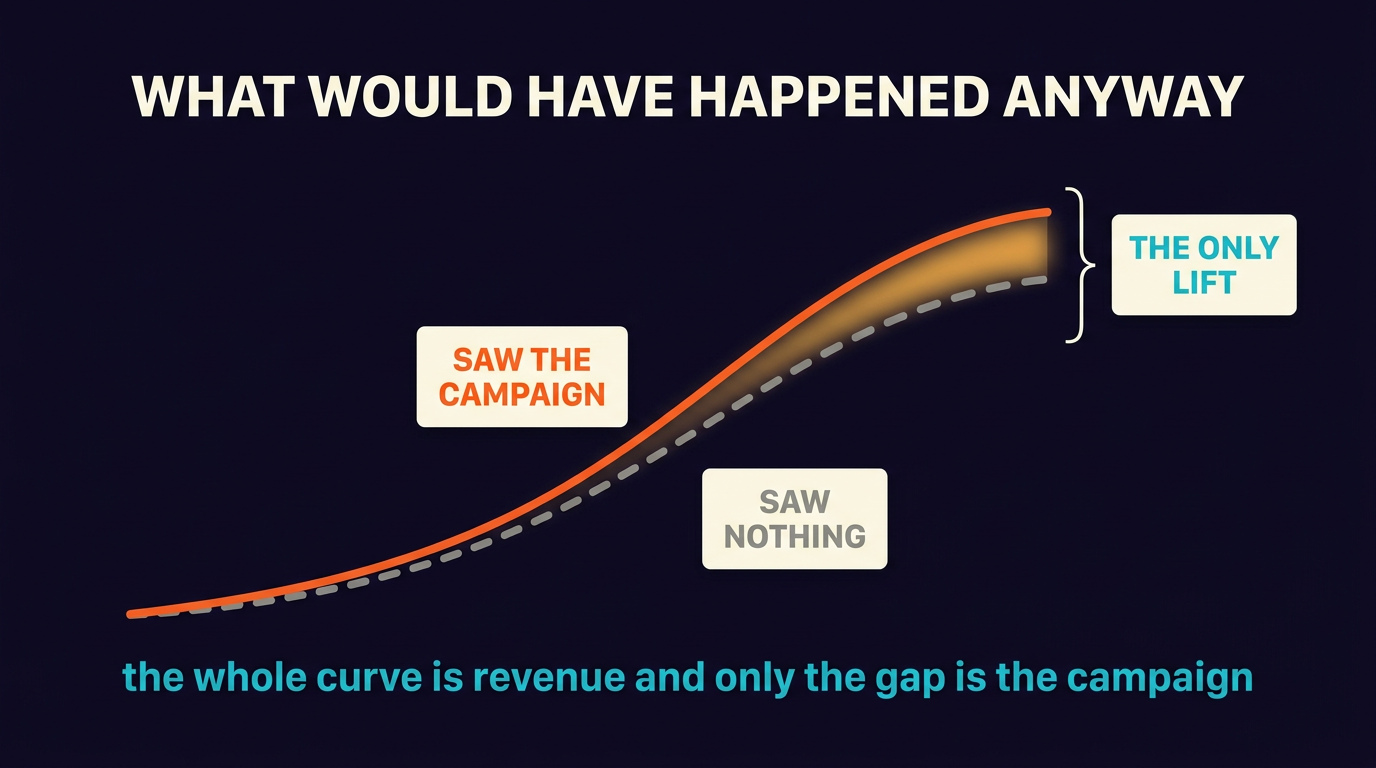
The second is ghost ads. Inside Facebook and Google, randomly assign users to a treatment group (sees the ad) and a control group (sees a placeholder or nothing). Compare conversion rates. The platform serves the experiment and reports the lift. Meta's Conversion Lift studies and Google's Brand Lift studies are productized versions of this. Ghost ads require enough budget to power the test (Meta's minimums for Conversion Lift start around $10K to $30K depending on the geography) and produce defensible incrementality numbers per campaign.
The third is PSA tests. Replace the actual ad creative with a public-service-announcement creative for a portion of the audience. Both groups see ads; only one group sees your actual creative. The PSA group is the control. The difference in conversion rates between the two groups is the incremental impact of your specific creative. PSA tests work especially well for awareness campaigns where the creative quality is the variable.
All three methods rest on building a believable counterfactual, and the campaign's measured lift is meaningful only when the comparison group represents the world without the campaign. Most attribution failures are counterfactual failures, not measurement failures, so build the counterfactual carefully.
Marketing Mix Modeling: the long view
Marketing Mix Modeling (MMM) sits at the strategic layer above incrementality. Where incrementality answers did this specific campaign work?, MMM answers how should we split next year's budget across channels?. The math is regression: revenue regressed against media spend by channel and time period, with controls for seasonality, external factors (industry events, macro indicators, competitive activity), and saturation curves (the diminishing returns each channel exhibits as spend increases).
MMM was the domain of $200K-per-year specialty consultancies until Meta open-sourced Robyn and Google released LightweightMMM. Both are Bayesian MMM frameworks that an operator with intermediate Python skills can run on their data. Robyn is more mature and ships with a UI; LightweightMMM is more flexible and integrates better into a custom Python stack. Either gets you to a defensible MMM output for the cost of compute and a few weeks of analyst time.
MMM has constraints: it needs at least 24 months of weekly data for reliable estimates, it assumes the future will look enough like the past that historical elasticity curves still apply, and it can't tell you about a brand-new channel because the model has no history for it. Inside those constraints, MMM is the right tool for annual budget allocation, scenario planning (what if we cut paid social by 30 percent?), and the conversation with the CFO who wants a defensible plan rather than last-click ROAS theater.
The operator-scale attribution stack
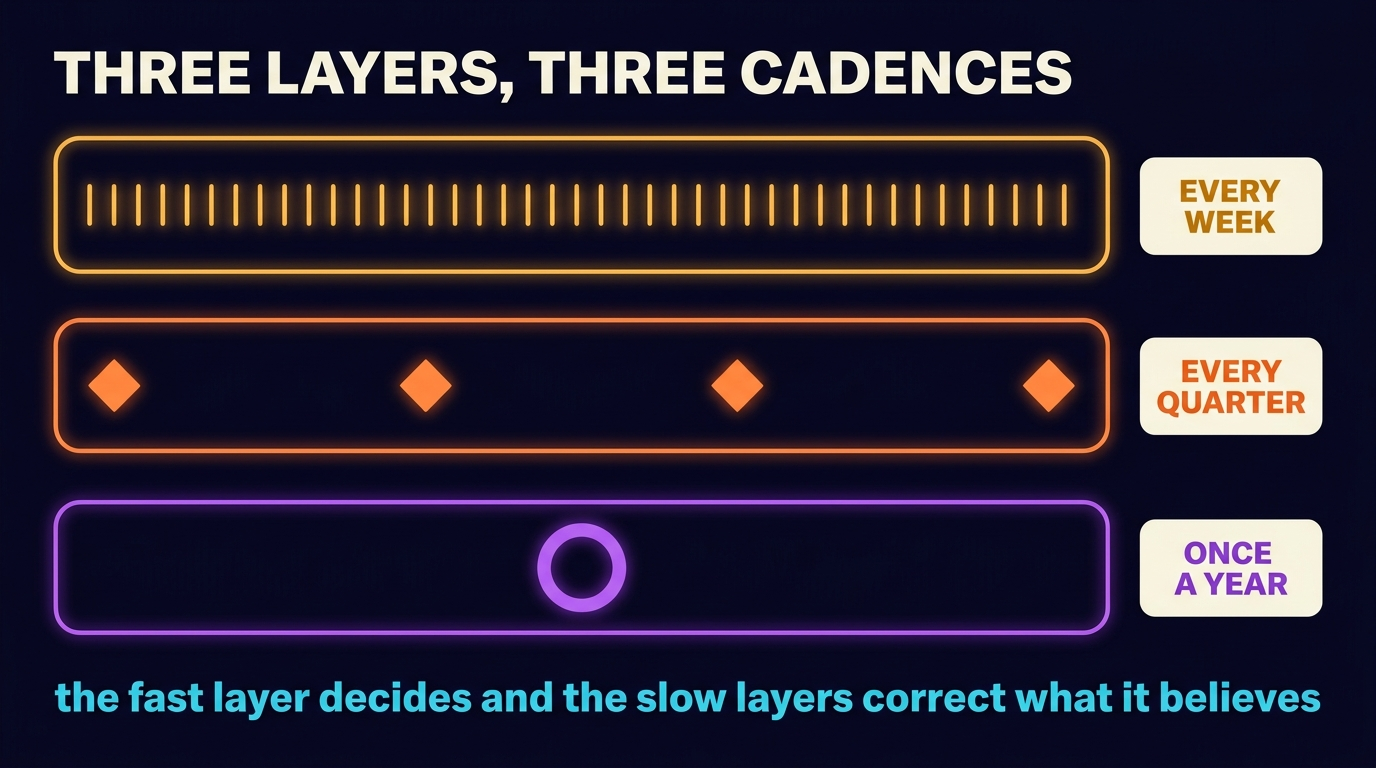
The stack for an operator at the $5K to $25K monthly retainer scale uses three layers.
Layer 1: rules-based MTA for daily decisions. It runs time-decay or position-based attribution on your normalized warehouse data, as described in Source to Model, Observed. The output feeds the dashboards the operator looks at on Monday. Time-decay is the right default for most engagements, and position-based fits when the upper-funnel channel is a heavy lift you need to keep visible. The rules-based output is what the operator acts on day-to-day.
Layer 2: incrementality tests on the largest channels, quarterly. Run Meta Conversion Lift studies on whichever channel is consuming the largest share of the budget, geo-holdouts on the second-largest channel, and PSA tests on creative-driven awareness campaigns. The cadence is quarterly because incrementality tests cost meaningful budget and need a few weeks of run time to power up. The output recalibrates the rules-based attribution between tests: if Meta lift testing shows that branded search is 80 percent free, the rules model gets a coefficient adjustment.
Layer 3: MMM for annual budget. Once a year, run Robyn or LightweightMMM on the past 24 months of weekly data. The output is the elasticity curve per channel and the recommended budget split for the next 12 months. The MMM output is the artifact you bring to the CFO conversation about next year's plan. It's also the artifact that survives the next iOS privacy change because it works on aggregate data, not user-level tracking.
Server-side conversion APIs (Meta CAPI, Google Enhanced Conversions) are now table stakes. iOS 14.5 destroyed enough client-side signal that operating without server-side conversion data turns every attribution layer into noise. The setup is a one-week engineering investment and the recovered signal compounds across all three layers. If the stack doesn't include server-side conversion ingestion, fix that before fixing anything else.
Case evidence
Three engagements anchor the operator-scale practice.
Forensic ad audits. The recurring misallocation pattern from the last-click section is mostly an attribution failure. Audit work reconciles ad-platform-reported revenue against actual revenue at the order grain, surfaces the channels that the platform credit-grabs, and produces a corrected attribution view that the operator uses to redistribute budget. The corrected view typically rebalances 10 to 30 percent of spend within weeks. See Forensic Ad Audits.
Solar portfolio brain. Fifty-plus solar accounts at one agency each told its own per-account ROAS story. Centralized attribution surfaced patterns the per-account view missed: certain audiences performed differently across geos, certain creatives carried disproportionate halo effects on branded search. The portfolio brain made these patterns visible and the agency began allocating across accounts based on portfolio-level lift instead of per-account narrative. See Solar Portfolio Intelligence.
Home decor cohort discovery. The DTC metal-art brand had a Facebook-reported ROAS picture that pointed at the wrong audience. Cohort analysis on the raw data, by creative, age, device, and headline, revealed the actual buyer (45+ women on iPhone, gift purchases). The budget was rebuilt around the new audience and redirected toward the lift, and revenue moved from $10K to $150K monthly inside 90 days. The dashboard would have lied; the cohort analysis told the truth. See Home Decor E-Com.
Anti-patterns to avoid
Last-click as default. The default in GA4 and most ad platforms is some flavor of last-click or last-non-direct-click. Operating on those defaults is operating on a known lie. Switch the default to time-decay or position-based on day one of any engagement.
Trusting platform-reported attribution as ground truth. Meta wants to credit Meta. Google wants to credit Google. Both platforms count assisted conversions liberally. Reconcile every platform's reported numbers against the warehouse-side truth before acting on them. The platforms are reporting from their own perspective, not lying on purpose. The operator needs the cross-platform truth, not the per-platform marketing of their own performance.
Underpowered incrementality tests. A geo-holdout with 5 percent of the budget on a 10-day window will produce a result that's statistically indistinguishable from noise. The test will look like the campaign didn't work, the operator will cut the campaign, and the budget will redistribute to the wrong place. Power the test or don't run it. If the campaign can't afford to be paused for a real holdout window, the test you can run is geo-staggering at full spend, not a small holdout.
Buying a $200K attribution platform before validating with the operator-scale stack. Most attribution platforms wrap the same Markov-chain math on the same warehouse data the operator could query themselves. Validate the discipline at low cost first (rules-based MTA on warehouse, quarterly incrementality, annual MMM). Then, if the operational scale or cross-team coordination demands a platform, the procurement conversation is informed by the patterns the operator already knows.
Where to start
There are three places to start.
Easiest, do today. Switch the default attribution model in GA4 and your ad platforms from last-click to time-decay or position-based. The change takes ten minutes. The new view will look different from the old view and most stakeholders will notice within a week. Use the difference to start the conversation about what your real channel mix looks like.
Medium, this week. Set up server-side conversion ingestion (Meta CAPI, Google Enhanced Conversions) if you haven't already. Then reconcile the platform-reported revenue against the warehouse-side actual revenue at the order or signup grain. The reconciliation will surface where the platforms are over-counting (typically by 20 to 60 percent in 2026) and let you correct your decision-making against truth instead of marketing. As Source to Model, Observed lays out, the reconciliation is a pipeline workload, not a spreadsheet.
Hardest, this quarter. Run a real incrementality test on the largest channel in the budget. Power it correctly. Honor the result. If the test shows that the channel is contributing 40 percent of what last-click claimed, redistribute the budget to whichever channel actually carries the lift. The first time the operator does this and the resulting quarter is better than the last quarter, the discipline becomes durable. Don't skip the act-on-the-result step. Most attribution work fails at the political moment when the result is uncomfortable, not at measurement.
Last-click is bookkeeping. Multi-touch attribution is better bookkeeping. Incrementality is the only direct measurement of cause. Marketing Mix Modeling is the strategic layer above all of it. Build the stack at operator scale and trust the answer enough to act on it. For the upstream pipeline that makes any of this possible, see Source to Model, Observed. For the dashboards that turn these numbers into weekly decisions, see Three Numbers That Decide.