
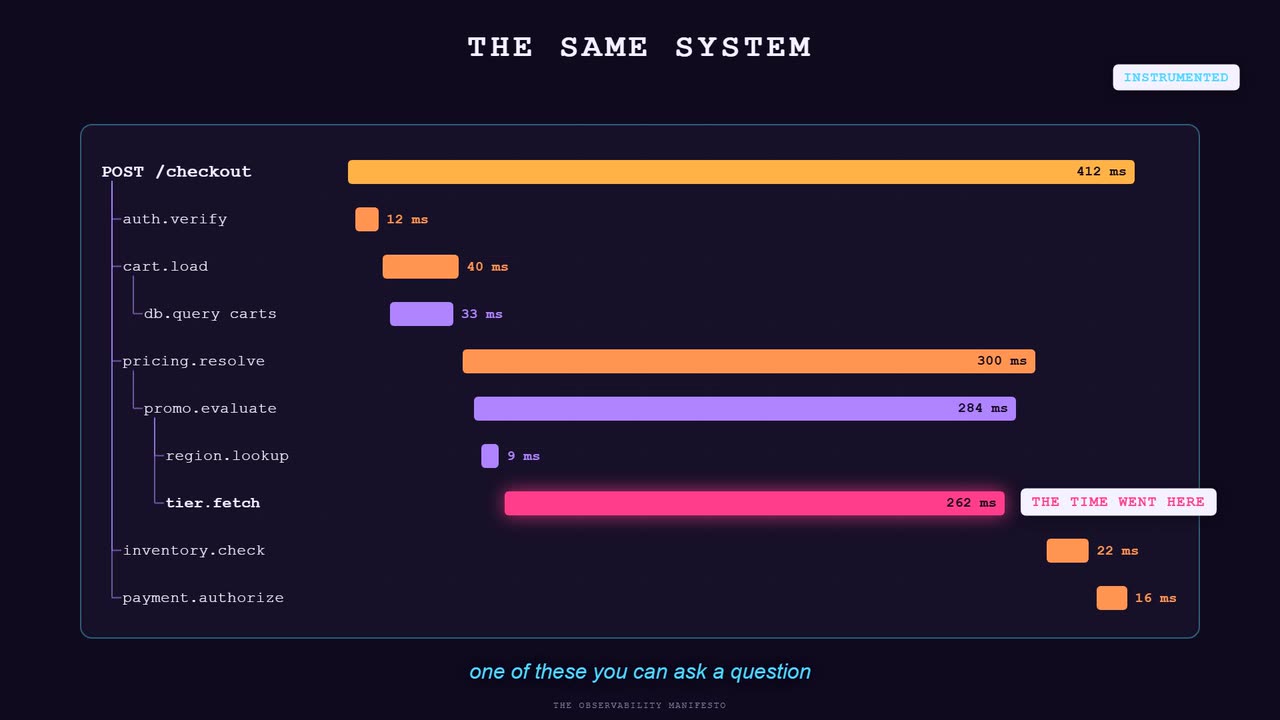
A function runs ten thousand times a day in production. It succeeds. You know it succeeds because nobody has complained. That's the entire evidence base, and it's the same evidence base a medieval physician had for bloodletting.
I want to be precise about what is missing there, because the usual framing of this argument is a scolding about logging and it deserves better. The function succeeded. That much is true. What you don't know is how long it took, whether that was longer than yesterday, what it was handed, what it handed back, which branch inside it fired, how many times it retried before it got an answer, what it cost you in a rate-limited external budget, and whether the nine thousand successes hid two hundred that were technically successful and semantically garbage. Every one of those is a fact about a thing that already happened, sitting in the past, permanently unrecoverable, because nothing wrote it down.
Software you cannot interrogate is software you are hoping about. When it works you can't say why. When it breaks you can't say why. You're performing a rite and waiting to see whether the machine is appeased, and "have you tried turning it off and on again" is a rain dance that works often enough to keep the tribe believing.
Software you cannot see is software you are hoping about
The print-statement loop, and what each turn of it costs
Most people run the same procedure when something breaks in production. You try to reproduce it locally, which works if the failure depends only on code and fails if it depends on data, timing, concurrency, or a third party having a bad afternoon. You add a print statement where you suspect the problem. You deploy. You wait for the failure to happen again, which on a rare bug means waiting hours. You read the output, learn that your suspicion was wrong but that the problem is somewhere to the left of it, add three more print statements, and deploy again.
Count what one turn of that loop costs: a build, a deploy, a wait for the failure to recur, and a context switch for whoever is doing it. On a healthy pipeline that is fifteen minutes of wall time and a full loss of whatever else that person was holding in their head. On an unhealthy one it's an afternoon. The loop is also worse than it looks, because each turn only answers the question you thought to ask before you deployed, and the whole reason you're in the loop is that you don't yet know which question matters.
Then, when you find it, you delete the print statements. The evidence is destroyed as the last step of the investigation. The next person who hits a neighbouring bug starts from zero, and there is a decent chance the next person is you in five months, cursing whoever removed the one line that would have made this obvious.
The car with no dashboard
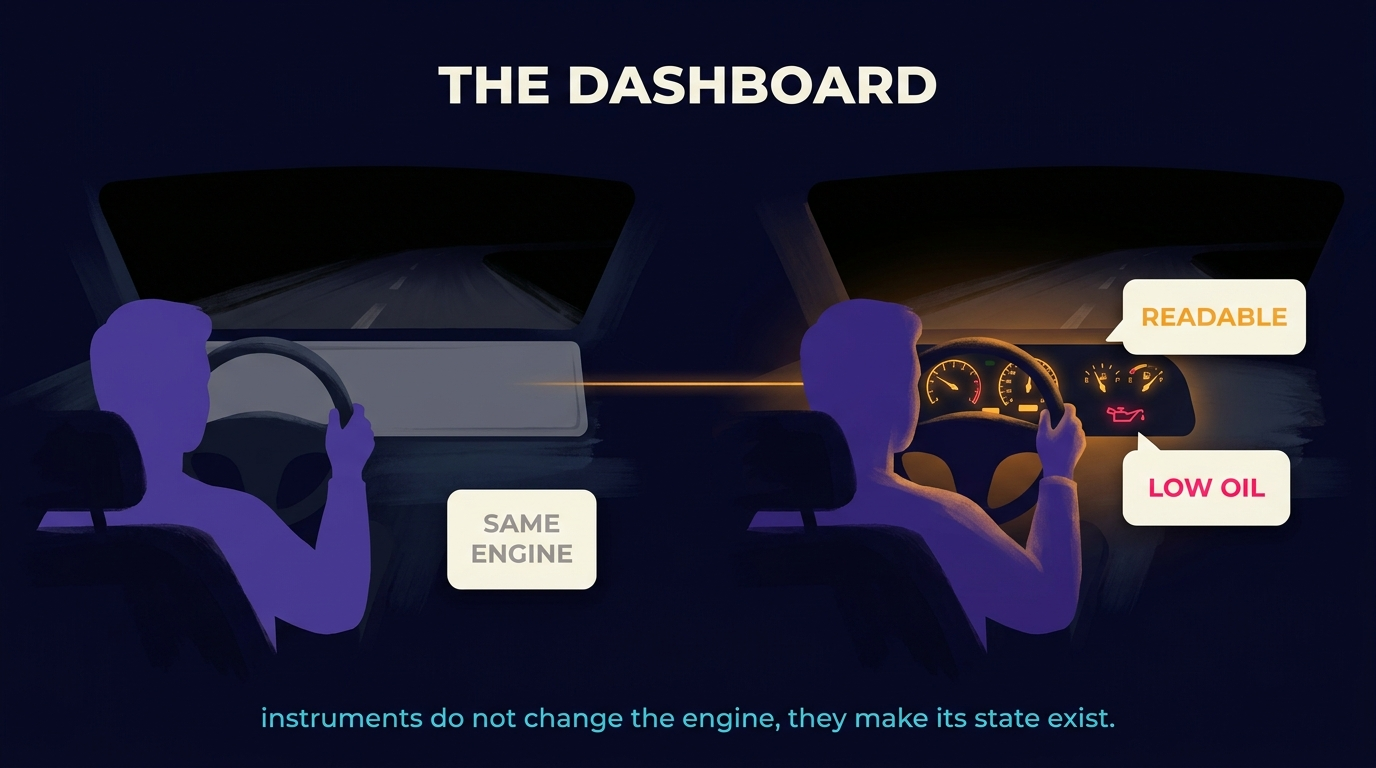
The comparison I keep coming back to is a car with no instrument panel. It drives. Everything a car does mechanically, this car does. You can commute in it for a year. You also won't learn that you're low on oil until the engine seizes on a highway at three in the morning, and the reason is that the car was built without any surface through which it could tell you about itself, not that it was badly built.
A dashboard is easy to mistake for decoration. A fuel gauge is a claim about a quantity that already existed inside the tank. The oil light is a threshold on a measurement that was always being taken by the metal. The instruments surface the state without creating it. A car without them is in the same mechanical condition as a car with them, only unreadable. That distinction is the whole argument of this entry. Instrumentation adds no health to your system and makes the health it has a thing that exists in the world rather than only in the system.
The failure mode this produces is specific and I have watched it happen more than once. A call to an external API that normally takes three hundred milliseconds starts taking five and a half seconds. Nothing errors. Every request eventually succeeds. Timeouts are generous, so nothing trips. Queues absorb it, so nothing backs up visibly. Users experience it as the product feeling slightly worse than it used to, which is a feeling they don't file tickets about; they just use it less. Three weeks later somebody notices a chart going the wrong direction and has no idea when it started, because nothing was recording the thing that changed.
A thirty percent shift in a number nobody was watching
Take a concrete one from a content ingestion pipeline. A chunking step splits transcripts into semantic pieces before they get embedded. One day it starts producing thirty percent more chunks per document than it did the week before. Nothing throws. Every downstream stage handles the larger volume without complaint. Costs go up slightly and get absorbed into a monthly bill nobody itemises.
What that number means is that something upstream changed shape. Maybe a transcript source started returning different punctuation and the splitter is now breaking on it. Maybe an encoding issue is inserting characters the tokeniser counts. Whatever it is, the embeddings that come out the other side are computed over differently-shaped inputs than the ones already sitting in the vector store, and search quality across the whole corpus is now quietly degrading in a way that will take months to attribute.
A thirty percent shift in a number that nobody is watching is the only warning you are going to get. The instrumented version of that pipeline notices the distribution move on the day it moves, because chunks-per-document is a value that gets recorded on every run and a value that gets recorded can be compared against its own history. The uninstrumented version finds out from a customer, eight weeks later, in the form of a complaint that search has gotten worse.
What this entry covers, and what it argues
This is a long entry, and it moves from the argument to the mechanism to the money. In order, it covers why monitoring and observability are different disciplines rather than different budgets, what a span actually is field by field, how to wrap code so it reports on itself, why cardinality is the load-bearing technical property underneath all of it, how to instrument a decision rather than only a duration, how lineage and correlation turn a pile of events into a story, what the discipline costs in CPU and in dollars and how sampling settles that bill, the pattern language worth stealing, why architectural separation is what makes any of it possible, and what changes when the system you're watching doesn't do the same thing twice.
Every number in this entry is either cited, or shown as arithmetic with its assumptions on the page. Observability is a field with a lot of vendor folklore in it, including some folklore I used to repeat, and an entry that argues for measuring things has no business being unmeasured itself.
Monitoring answers the questions you already asked
Two disciplines that share a budget line
Monitoring and observability get sold as the same product and billed on the same invoice, which has done real damage to how teams think about both. They are different activities with different shapes.
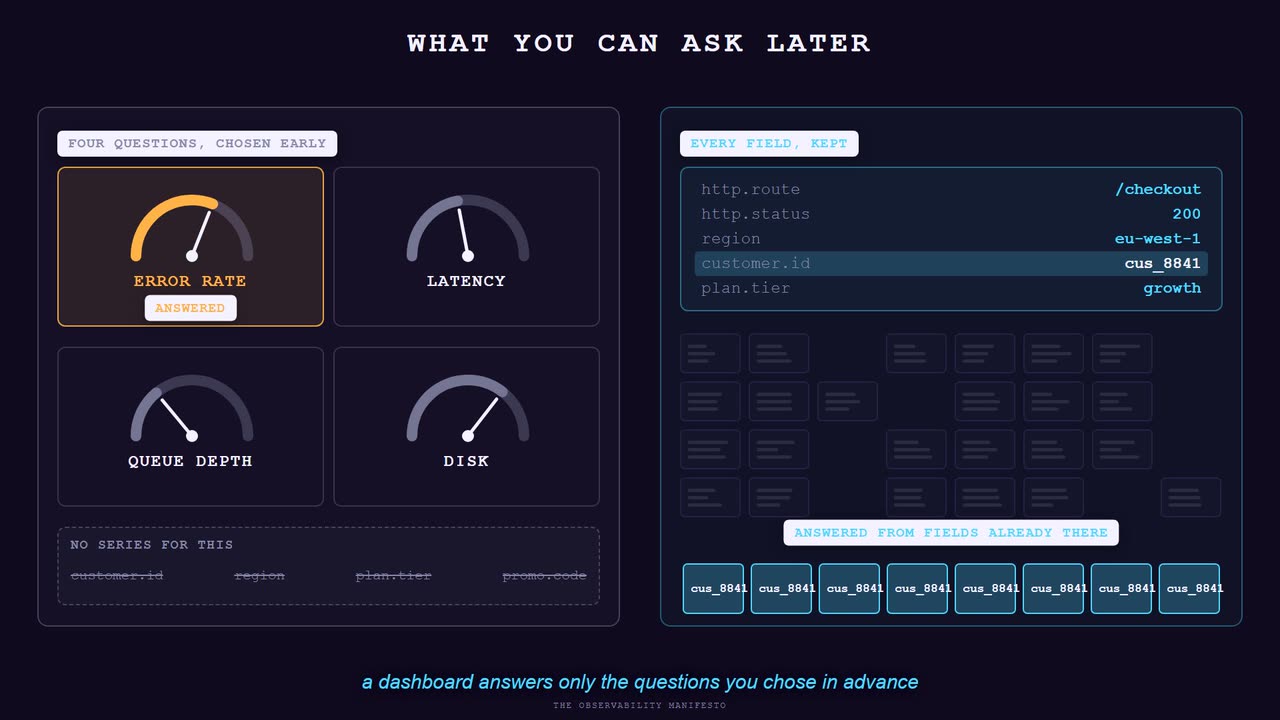
Monitoring is the practice of watching for failure modes you already know about. You decide in advance that request latency matters, error rate matters, queue depth matters and disk fill matters. You emit those four numbers, chart them, and set a threshold on each. When one crosses its threshold something wakes you up. Monitoring is valuable, and nothing in this entry argues against it. A threshold on a known failure mode is the cheapest reliability mechanism that exists, and a team with four good alerts is in far better shape than a team with none.
Observability is the ability to ask a question you had not anticipated, about a system that is running right now, and get an answer without shipping code. That last clause is the whole of it. If answering "which customers were affected" requires adding a log line and deploying, then you can't answer it about the incident that already happened, only about the next one. The system has to have already recorded enough about itself that a question invented after the fact still lands.
The test I use to tell them apart: if the answer requires a deploy, that was monitoring's job and monitoring did not cover it. Observability is measured entirely by what you can learn about a past minute using only what the system already wrote down.
Where each one is the right tool
Neither is a superset of the other, and treating them as a maturity ladder where observability replaces monitoring produces expensive systems that still fail to page anybody at three in the morning.
| QUESTION SHAPE | WHAT ANSWERS IT | WHEN THE QUESTION IS FORMED |
|---|---|---|
| Is error rate above two percent? | a metric and a threshold | before the incident |
| Is the queue draining slower than it fills? | a metric and a threshold | before the incident |
| What is different about the requests that failed? | wide events you can group by any field | during the incident |
| Did this only break for accounts created after the migration? | wide events you can group by any field | during the incident |
| Which of my six pipeline stages got slower, and when? | per-stage spans in one trace | during the incident |
Read the right-hand column, because it's the load-bearing one. The top two questions can be written down on a calm Tuesday. The bottom three can only be written down by somebody staring at a graph that is doing something strange, and by then it's far too late to go add a field.
The three pillars are a shipping format, not a definition
Almost every vendor page opens by telling you observability has three pillars: metrics, logs and traces. Buy three products, wire three pipelines, and you have observability. It's a tidy story and it survives because it maps cleanly onto a purchase order.
The framing has a real basis. OpenTelemetry itself organises around signals, and traces, metrics and logs are exactly how telemetry gets structured, transported and exported. Logging reached general availability recently and continuous profiling reached release-candidate status in early 2026 as a fourth signal. The signals are real and you can't work in this field without knowing them.
What the pillars framing gets wrong is treating a transport taxonomy as a definition of a capability. Metrics, logs and traces are three ways of shipping information about the same underlying events. A metric is those events counted and collapsed. A log line is one of those events written as text. A span is one of those events with timing and parentage attached. Organising your thinking around the three formats leads you to duplicate the same fact in all three, and to reach for the cheapest and least informative of them by default.
The practitioner position, argued most consistently by the Honeycomb people, runs the other way. Start from the event. Make it as wide as you can afford. Honeycomb's own instrumentation guidance is blunt about the tradeoff: "Adding a piece of data to your current span is the best... More information on one event gives us more correlation power. It's also cheaper." Their answer to the question of whether a new fact deserves its own span or belongs as a field on the existing one is, almost always, the field.
So this entry treats observability as a property of your data, and signals as how that data travels. You need telemetry that is structured (key and value pairs with defined meanings rather than prose), wide and high-cardinality (user identifiers, request identifiers, feature flags, tenant, version, the branch that fired), and queryable without a code change (you can slice by a field you didn't think about when you shipped). Signals carry that. They don't constitute it.
Adopting the standard does not grant the capability
One correction made early saves a wasted quarter. OpenTelemetry graduated from the Cloud Native Computing Foundation in May 2026, which is what makes calling it the vendor-neutral standard a description rather than a hope. It gives you one set of APIs, SDKs, a collector and a shared vocabulary, and it means you can change backend without re-instrumenting your codebase.
It doesn't give you observability. OpenTelemetry is an instrumentation and transport layer. Whether you can ask a new question of last Tuesday depends on whether the thing at the other end preserved the dimensionality it received or aggregated it away on ingest. A backend that rolls your spans into per-endpoint averages has thrown out precisely the fields that would have answered the question, and it did so before you knew you had one. Instrumenting perfectly into a store that collapses dimensions gets you a vendor-neutral pipeline feeding a system that still can't tell you which customers were affected.
The span is the unit everything else is built from
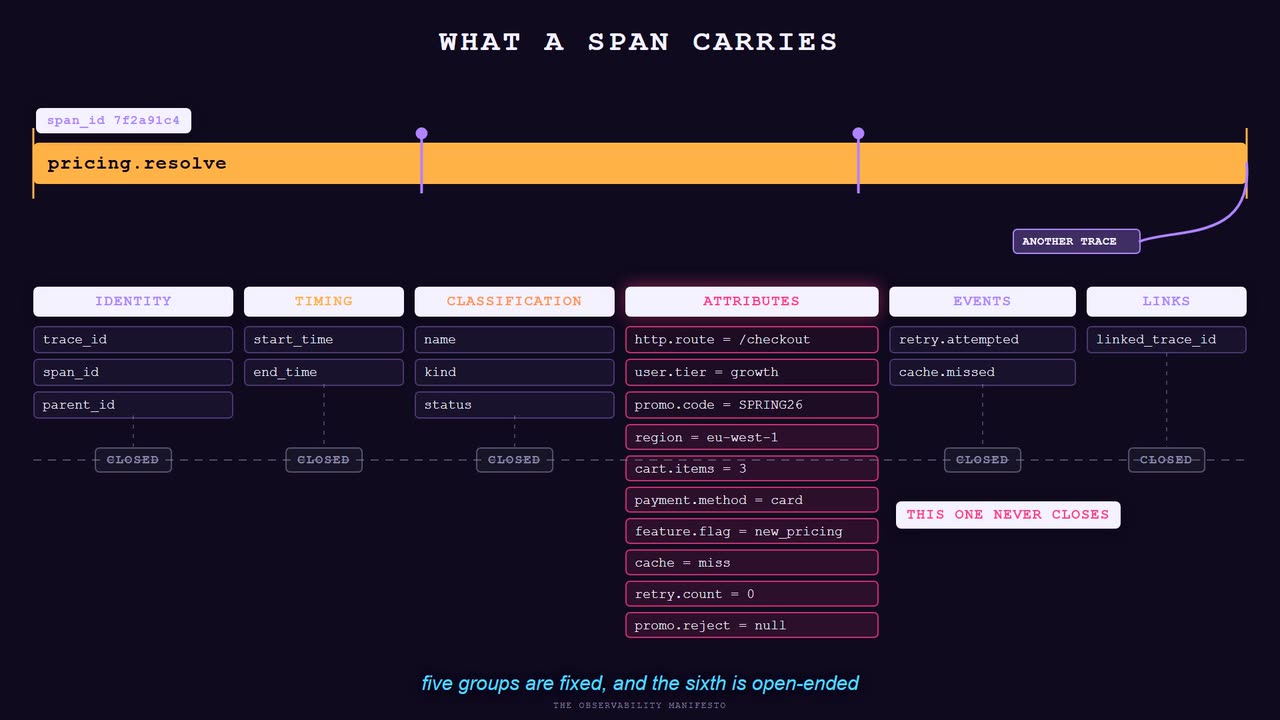
Every practice in this entry reduces to one object, so it's worth being exact about what that object holds before arguing about how to use it. A span represents a single unit of work: a request handled, a query executed, a message consumed, a function that matters. A trace is the tree of spans produced by one logical operation as it moves across services.
What a span actually carries, field by field
The OpenTelemetry specification is precise about this, and the precision matters because most people carry a vaguer mental model than the object deserves.
| GROUP | FIELDS | WHAT IT BUYS YOU |
|---|---|---|
| Identity | trace ID, span ID, optional parent span ID, trace flags | the tree. Parentage is what turns loose records into one story. |
| Timing | start timestamp, end timestamp | duration by subtraction, and the ability to see which child ate the parent's budget. |
| Classification | name, kind (server, client, internal, producer, consumer), status | grouping. Every aggregate you ever compute groups on these. |
| Attributes | string keys to string, number or boolean values, unbounded in count | every question you did not think of in advance. This is the whole game. |
| Events | timestamped annotations inside the span | ordering inside one operation. Retries, cache misses, guardrail trips. |
| Links | references to spans in other traces | causality across asynchronous boundaries, where parentage cannot reach. |
The minimum a span needs to be valid is a name, a start time, an end time and a status. The minimum a span needs to be useful is considerably more, and the gap between those two sentences is where most instrumentation projects quietly fail. A codebase covered in valid spans that carry nothing but timings produces a beautiful waterfall diagram that answers exactly one question, which is where the time went, and no question at all about why.
Naming is a cardinality decision disguised as a style question
The most consequential rule in span design looks like a bikeshed and isn't. A span name is a low-cardinality template describing a class of operation, never an instance. For an HTTP server, OpenTelemetry's guidance is to use the route pattern:
correct    GET /users/{id}
wrong      GET /users/8814ff20-3c1a-4e1b-9f77-0a2d
correct    publish orders.created
wrong      publish orders.created#msg-7741023
The reason is mechanical. Span names become grouping keys, and a backend that derives metrics from spans turns the name into a label. Put an identifier in the name and you have created one series per identifier, which means one series per user, per order, per message. Your latency chart becomes a million charts of one data point each, none of which can be read and all of which cost money to store.
The identifier isn't thrown away. It moves one field to the left and becomes an attribute, where it belongs, where it costs almost nothing structurally, and where you can filter on it. The name is the class, the attributes are the instance. Getting this backwards is the single most common way a well-intentioned instrumentation pass makes a metrics bill explode, and it usually gets caught by finance rather than by engineering.
Semantic conventions, or why your key should not be your idea
OpenTelemetry publishes semantic conventions: agreed attribute keys with agreed meanings for common domains. http.route, http.request.method, db.system, messaging.system, and more recently a gen_ai.* namespace for model calls.
Inventing myapp.httpVerb when http.request.method exists feels harmless and costs you three things. Cross-service queries break, because the service instrumented by an auto-instrumentation library emits the conventional key and yours emits a different one, so "show me every outbound call by method" silently returns half your traffic. Backend tooling stops helping, because dashboards, exemplar linking and anomaly detection are built to recognise conventional keys. And every future integration inherits a translation step that somebody has to maintain.
Use the convention where one exists, and add your own keys alongside rather than instead. Custom attributes are correct and necessary for anything genuinely specific to your domain, which is most of the interesting ones. Namespace them under something you own, keep the names stable, and treat a rename as a breaking change to a public interface, because for every saved query and dashboard in your organisation, it's one.
Wrapping a function so it reports on itself
The mechanism I reach for first in Python is the decorator, because it lets the observation live somewhere other than the logic. A decorator wraps a function in another function that calls the original, does the same job, returns the same result, and along the way writes down what happened. The wrapped function doesn't know, and it just does its work while something outside it takes notes.
From black box to glass box
Without instrumentation a function is opaque. Arguments go in, a value comes out, and the space between is unavailable to you. Wrapped, the same function becomes readable: you get the arguments it was handed, how long it ran, what it returned or which exception it raised, and any attributes you chose to attach on the way through.
# the function does not change and does not know
@observe_async(component="ingest", capture=["video_id", "channel_id"])
async def fetch_video_metadata(video_id: str, channel_id: str) -> VideoMeta:
    ...
The value of putting it here rather than inline is that the instrumentation has one definition and a thousand call sites. When you decide that every observed function should also record the retry count, you change one wrapper. Instrumentation written inline gets changed in a thousand places, which means it gets changed in eleven places and then everyone gives up and the telemetry becomes inconsistent, which is worse than absent because inconsistent telemetry produces confident wrong answers.
The layers compose, and that is the actual feature
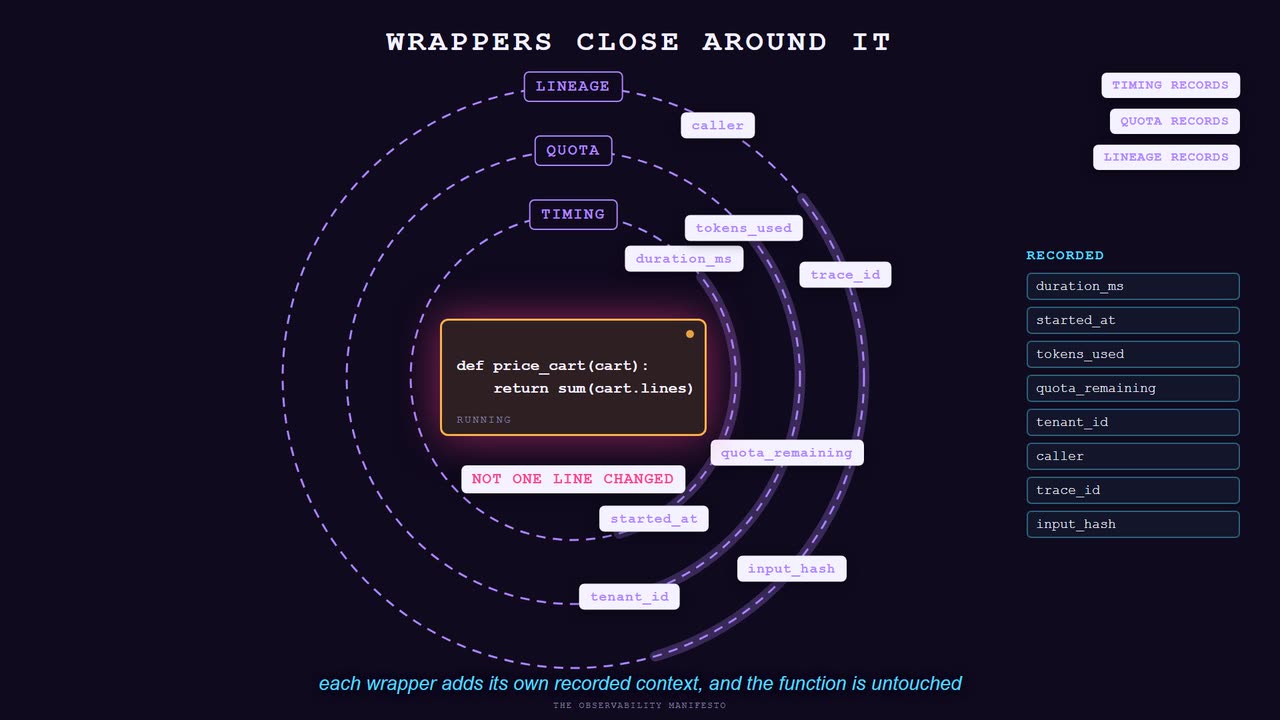
Decorators stack. You can put performance timing on the outside, quota accounting under it and lineage checkpointing under that, and each layer contributes its own attributes to the same operation. Each concern is written once, tested once, and applied by adding a line above a function signature.
A stack of decorators is the same shape as middleware in a web framework, as render pipeline stages in a game engine, and as transaction interceptors in a blockchain client. Transparent enhancement is a general pattern and observability is one of its best applications, because observability is exactly the kind of concern that must touch everything and belongs to nothing.
What to capture, and the discipline of not capturing everything
The obvious move once you have a wrapper is to capture the full arguments and the full return value on every call. That's a mistake.
Full-payload capture fails in four separate ways at once. It is expensive, because serialising a large object on every call costs CPU inside your request path and bytes on your bill. It is dangerous, because payloads contain personal data, credentials and tokens, and a telemetry pipeline is a copy of your production data with weaker access controls and longer retention. It is useless at query time, because a blob of serialised JSON in one field can't be grouped or filtered on. And it hides the signal, because the two fields that would have told you something are now buried in four kilobytes of fields that tell you nothing.
So capture is a designed list, not a dump, and these are the rules I apply:
- Named fields, chosen in advance. That means the identifiers you'd want to filter by, the flags that change behaviour, the sizes and counts that describe the shape of the input.
- Shapes instead of contents. Record the transcript's character count, not the transcript itself, and for a response body, the number of items in it and whether it was truncated. Shape is nearly always the thing you query on, and it's small and safe.
- Bounded strings. Truncate at a defined length rather than letting one pathological input write a megabyte into your trace store.
- Nothing secret, ever, by construction rather than by review. A denylist maintained by hand is a leak with a schedule. Capture from an allowlist and the class of failure disappears.
- The full exception, including the traceback and the exception type as its own field. This is the one place where more is right. "Something broke" isn't an acceptable error record for adults who get paid to run systems, and the type as a separate attribute is what lets you count error classes rather than reading them one at a time.
Categorising duration, and why a bucket beats a number
Alongside the raw millisecond count I record a category: fast, normal, slow, very slow. Recording both looks redundant and isn't, because they answer different questions. The number lets you compute percentiles and see distributions. The category lets you count and alert without deciding on a threshold at query time, and it makes a whole class of question cheap: how many operations in this component were very slow today compared with last Tuesday.
The boundaries aren't arbitrary and shouldn't be invented per service. Human perception research gives you the anchors, and they have been stable for decades. Somewhere around a tenth of a second an interaction stops feeling instantaneous. Around one second a user's attention starts to wander from the task. Past several seconds people conclude the thing is broken and go do something else. Those are the real boundaries, because they are boundaries in the user rather than in your infrastructure.
What that buys you is prioritisation with a defensible basis. A very slow operation in a request path a human is waiting on is a fire. The same duration in a nightly batch job is a fact. Without categories those two look identical in a latency chart, and teams routinely spend a sprint optimising the second one because it had the bigger number.
Cardinality is the entire argument
Almost every confusing rule in observability, including the ones that look like arbitrary vendor policy, is downstream of a single storage fact.
The definition, stated exactly
Cardinality is the number of distinct combinations of label values that exist for a given metric. It's a property of the values, not of the labels, and that distinction is where most people's intuition goes wrong.
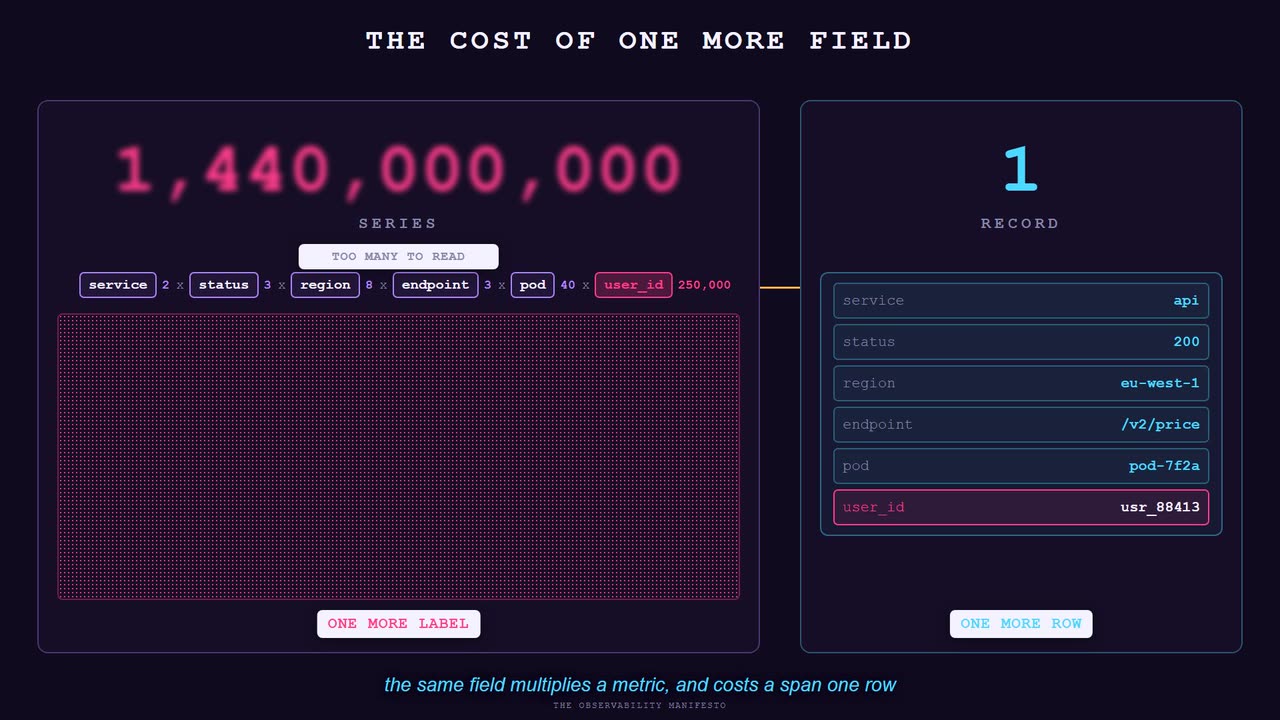
Take a counter called http_requests_total with labels for method, status code and region. Say you actually serve six methods, return eight status codes and run in three regions. The cardinality is at most six times eight times three, which is one hundred and forty-four. A hundred and forty-four series is nothing. It fits in memory, it charts instantly, it costs approximately zero.
Now add one more label, user_id, because during an incident somebody reasonably wanted to know which users were affected. You added one label. You didn't add one series. You multiplied the whole thing by your active user count, because a traditional time-series database stores one independent series per unique label combination, and each of those series carries its own index entry, its own metadata, its own memory footprint and its own chunk on disk.
| LABEL SET | DISTINCT VALUES | SERIES |
|---|---|---|
| method | 6 | 6 |
| + status | × 8 | 48 |
| + region | × 3 | 144 |
| + endpoint | × 40 | 5,760 |
| + user_id | × 250,000 | 1,440,000,000 |
Arithmetic, with its assumptions on the page: a service with forty routed endpoints, three regions and a quarter of a million monthly active users. The multiplication is exact; whether every combination actually occurs is a separate question, and in practice the observed count is lower than the theoretical product and still catastrophic. The point is the shape of the growth, which is multiplicative in the count of labels and linear in the size of the worst one.
What actually falls over, in order
The failure isn't a clean error, which is part of why it keeps happening. It arrives as a sequence of degradations that each look like a different problem:
- Ingest memory climbs. The backend holds an in-memory index of active series. More unique label sets means a bigger index, and the index grows even for series that receive two samples and are never seen again.
- Queries get slower across the board, including queries that have nothing to do with the offending metric, because the engine is scanning a far larger index to resolve any selector at all.
- Compaction and retention start missing their windows, because there is more to compact than the schedule assumed.
- Something gets killed for memory and the on-call engineer, reasonably, concludes that the monitoring system has a capacity problem rather than that a well-meaning pull request added one label.
The lag between cause and symptom is what makes this so expensive. The label was added in a change that looked trivial and passed review, because the diff was one string, and the failure arrives days later wearing a completely different costume.
The same field, forbidden in one place and required in the other
The advice "never put a user identifier in a metric label" and the advice "always put the user identifier on your span" are both correct, and they are correct for the same underlying reason.
A metric label is a dimension of a pre-aggregated structure. A span attribute is a field on an individual record. When you add a label to a metric you're asking the storage engine to maintain a separate running aggregate for every value that label takes, forever, whether or not you ever query it. When you add an attribute to a span you're writing a few more bytes onto one row that was already being written. The first is a multiplication. The second is an addition.
Aggregate early and you buy cheap storage by throwing away the dimensions before you know which one you will need. Aggregate late and you keep every dimension, pay more to hold them, and retain the ability to answer a question invented after the fact. That trade is the actual subject of this entire discipline, and everything from sampling policy to your monthly bill is a position taken on it.
The question that only high cardinality can answer
Error rate goes from 0.1 percent to 0.4 percent, which is four times worse and still small enough that most requests are fine.
Your dashboard shows a line move. That line is an aggregate over every request, which means it has already discarded everything that distinguishes the failing ones from the succeeding ones.
With wide events you ask a different shape of question entirely: take the failing requests and the succeeding requests, and tell me which field distributes differently between them. Maybe every failure carries the same deployment version. Maybe every failure has a feature flag enabled that only three percent of accounts have. Maybe they all came through one region, or from accounts created before a migration, or with a request body above a size that trips a code path nobody has run in a year.
Every one of those answers is a field, and a field you did not think to make a dimension is a field you cannot group by. A wide event earns its keep because its width was decided before you knew the question, and that width is what makes the question answerable at all.
Instrument the decision, not only the duration
Most instrumentation, including most of mine for the first few years, records that an operation happened and how long it took. That's an improvement over nothing, and it hits a ceiling faster than people expect. Duration and status tell you that something went wrong. They almost never tell you why, because the why is usually a decision the code made, and decisions leave no trace in a timer.
The branch is invisible in the timing
Take a pricing function. It takes an order and returns a number. Under the hood it checks eleven things: customer tier, promotional eligibility, regional tax rules, an inventory-based surcharge, a fraud score threshold, a legacy grandfathering clause for accounts older than a certain date. Each check can change the answer, and on any given call some subset of them fires.
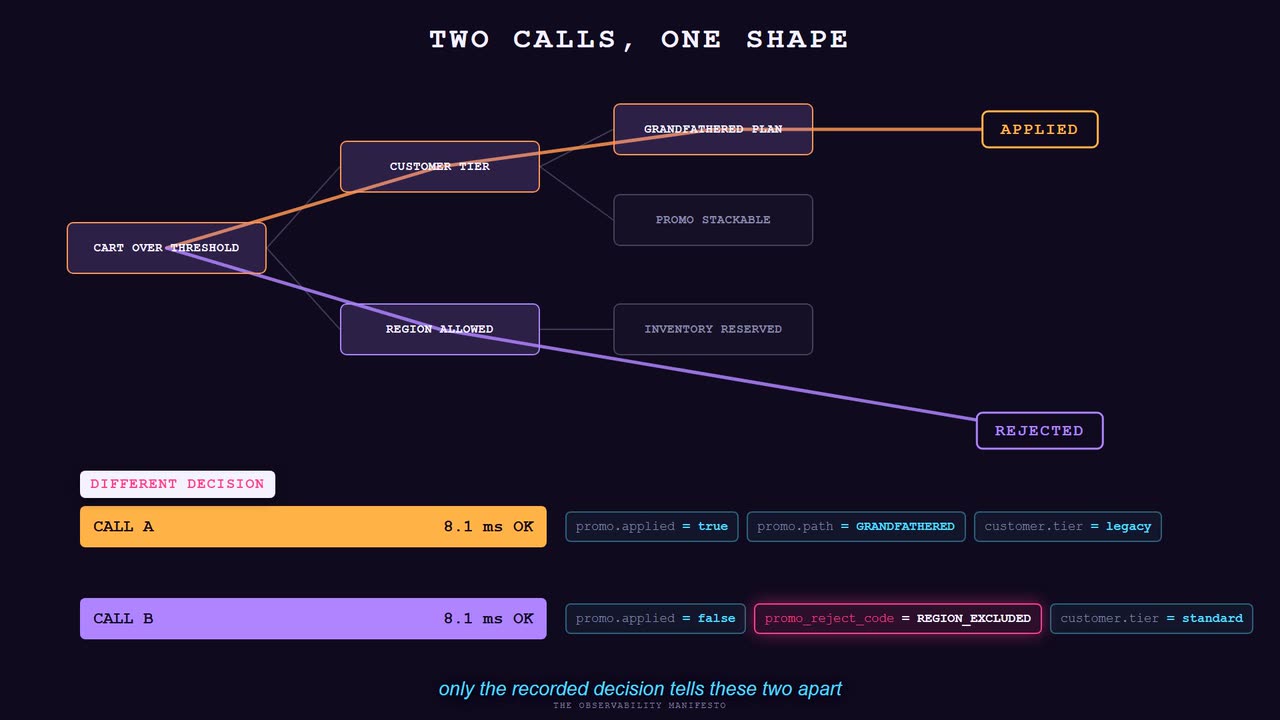
Instrumented for duration only, every call looks the same. Eight milliseconds, status OK. When a customer says they were charged the wrong amount, you have a record proving the function ran quickly and succeeded, which is precisely the least useful pair of facts available. Nothing you wrote down distinguishes the call that applied the grandfathering clause from the call that didn't.
Instrumented for decisions, the same span carries the answer:
span  price.calculate   8.1ms   OK
  pricing.rule_bundle       = "2026-06-r3"
  pricing.tier_applied      = "enterprise"
  pricing.promo_evaluated   = true
  pricing.promo_applied     = false
  pricing.promo_reject_code = "REGION_EXCLUDED"
  pricing.grandfathered     = true
  pricing.surcharge_reason  = "none"
The reject code is the field that earns its place. Anyone can record that a promotion wasn't applied. Recording the specific reason it was not applied turns a support ticket into a query and a class of tickets into a single answer. Somebody can now ask how many orders this month hit REGION_EXCLUDED, which is a product question that engineering can answer in ten seconds without reading any code.
What a decision record contains
Practice here is less standardised than HTTP or database instrumentation, which have published semantic conventions to lean on. The craft guidance across the field converges on the same four things, and I use them as a checklist:
- A stable identifier for the rule or branch that fired. Make it a short code, not a sentence. Codes survive translation, aggregate correctly and can be filtered on; prose can't.
- The version of the rule set that produced it. Without it, a query spanning a deploy silently mixes two different policies and produces a number that describes neither.
- The inputs that determined the branch, at the shape level rather than the payload level: the tier, the flag, the age bracket, the score band.
- The negative outcome and its reason, which is the one everybody skips. Recording only what happened means every question about what didn't happen requires reading source code and guessing.
A decision record becomes non-optional rather than merely valuable the moment any part of the decision is made by something you can't re-run deterministically.
Two places worth a span, and everywhere else is noise
The reflex once instrumentation is cheap is to wrap everything. That reflex produces traces with four hundred spans per request in which no single span means anything, a large overhead bill, and an on-call engineer who scrolls for a minute before finding the relevant row. The goal is to cover the places where questions form rather than everything.
Two categories account for nearly all of them:
Trust boundaries. A trust boundary is anywhere control or data crosses out of the part of the system you can reason about: an inbound request, a call to another service, a database query, a publish or consume on a queue, a third-party API, a read from object storage. Boundaries are worth a span each because they are where failures actually cluster, where latency actually accumulates, and where you have the least ability to reconstruct what happened after the fact. A boundary you didn't instrument is a place where your trace goes dark and where you will later be reduced to guessing.
Transformations. A transformation is anywhere data changes shape or a decision gets made: parsing, validation, enrichment, normalisation, chunking, embedding, ranking, the application of business rules. Transformations are worth a span because they are where correctness lives. A boundary span tells you the call succeeded; a transformation span tells you what the call did to the data.
Everything else, the internal helper, the loop body, the getter, belongs in the parent span as an attribute or an event if it belongs anywhere. That's the same judgment as the span-or-attribute question from earlier, and the answer is the same: attach it to the operation that is already being recorded rather than creating a new record.
The order to do it in
If you're starting from nothing, the sequence matters, because each step makes the next one more useful and doing them in the wrong order produces months of work with nothing readable at the end.
| STEP | WHAT YOU INSTRUMENT | WHAT IT UNLOCKS |
|---|---|---|
| 1 | Entry points: every API route, CLI command, message handler, scheduled job | the full lifecycle of every request, and a root to hang everything else from |
| 2 | Boundaries: outbound calls, queries, queue operations, third parties | attribution of latency and failure to the specific dependency causing it |
| 3 | Transformations: every stage that reshapes data or applies a rule | correctness questions, not just availability questions |
| 4 | Propagation: one correlation identifier threaded through every hop | isolated events become a single narrative across service borders |
| 5 | Aggregation: derived metrics, dashboards, alerts on the above | the shift from investigating after the fact to being told beforehand |
Step four is the one teams skip, and skipping it costs more than skipping any of the others. Steps one through three give you well-instrumented components that each tell a coherent local story. Without propagation those stories never join, and you spend incidents doing timestamp arithmetic across four dashboards trying to work out whether the thing you're looking at in one service is the same request as the thing in another.
Lineage, or where this piece of data has actually been
Tracing tells you what a request did. Lineage tells you what happened to a piece of data, which is a different question with a different shape, and in any system that transforms content rather than merely serving it, the second question is the expensive one.
One URL, eight transformations, seven states nobody kept
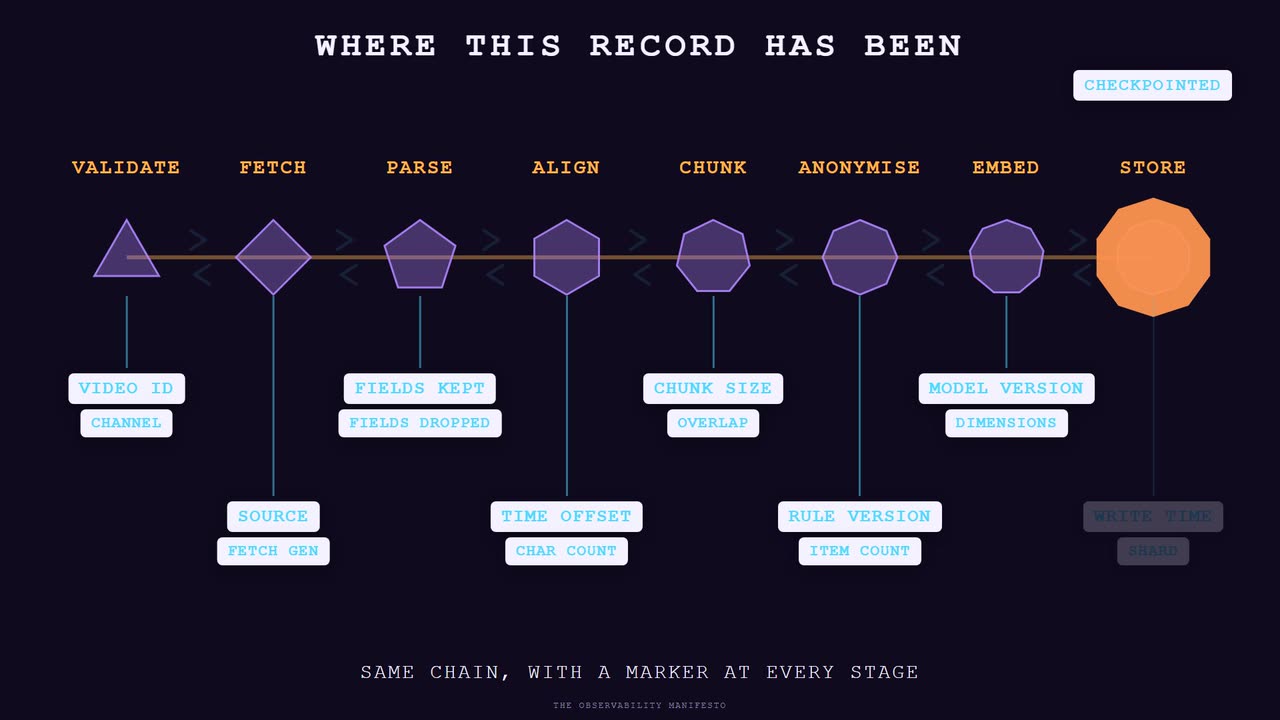
Follow a single video through an ingestion pipeline. It arrives as a URL, which carries almost nothing. It gets validated, and now it has an identity: a video identifier, a channel attribution, a place in a queue. An API call returns raw JSON, which is messy and complete. That JSON gets parsed into typed models, which is the first place information is deliberately discarded, because a typed model keeps the fields you declared and drops the rest.
A transcript arrives from a different source entirely, on a different schedule, with its own encoding assumptions. It gets aligned against the video timeline, then split into semantic chunks by a splitter with its own parameters. Comments come from a third API, get anonymised, threaded and scored. Everything that survives gets embedded, which converts text into a vector by a model with a version, and lands in a vector store.
By the time that record is queryable, it has been through eight distinct transformations, three external sources with independent failure modes, and at least four points where a parameter chosen by somebody months ago changed the result. Every one of those transformations produced an intermediate state that no longer exists.
The question that arrives six weeks later
Somebody asks why one document's search behaviour looks wrong. It surfaces for queries it shouldn't, or fails to surface for queries it obviously should.
Without lineage, answering that is archaeology. You have the final vector and the original URL and nothing in between. You can re-run the pipeline, which tells you what today's pipeline does with today's inputs and says nothing about what the pipeline did six weeks ago with the response the API returned that day. If a model version changed, or a chunk-size default moved, or an upstream source altered its encoding, you have no way to know, because the evidence was in the intermediate states and the intermediate states are gone.
With lineage, it's a query. You pull the checkpoint chain for that record and read it: the transcript arrived with a particular character count and encoding, the splitter ran with a particular chunk size and overlap and produced a particular number of chunks, the embedding ran against a named model version, the write landed at a particular time. Somewhere in that chain is a value that differs from the same value on records that behave correctly, and finding it is a comparison rather than an investigation.
What a checkpoint records, and what makes a bad one
A checkpoint is a marker written at a stage boundary. A timestamp alone is a bad checkpoint, and this is the most common way lineage gets implemented uselessly: a chain of markers proving the data passed through eight stages, which nobody ever doubted.
A useful checkpoint carries four things:
- The shape going in and the shape coming out. Character counts, item counts, dimensions, byte sizes. Shape changes are how you spot a transformation misbehaving without storing the payload.
- The parameters that governed the transformation, including their versions: chunk size, overlap, model identifier, threshold, rule set version. Record everything you'd need to reproduce the step, and nothing you already have.
- The provenance of the inputs. Which source, which fetch, which cache generation. When three sources feed one record, "which one was stale" is the first question and it's unanswerable without this.
- The identity of the record itself, threaded consistently so the chain joins. This is the same discipline as trace propagation, applied to data rather than to control.
The content itself is absent from that list, and it doesn't go in the checkpoint. Shape and parameters are almost always sufficient to localise the defect, and they are small, safe to retain and cheap to compare across millions of records. Storing the payload at every stage produces a second copy of your corpus with weaker access controls, at eight times the size, and it's rarely what you end up querying anyway.
Why this is not the same thing as tracing
Tracing and lineage get conflated because they share machinery.
| TRACING | LINEAGE | |
|---|---|---|
| Subject | one request | one record |
| Lifetime | milliseconds to seconds | weeks to years |
| Answers | where did the time go, what failed | why does this output look like this |
| Retention | days, sampled | as long as the record lives, unsampled |
| Read by | on-call, during | whoever inherits the quality problem, later |
The retention row is the one that changes an architecture. Traces are voluminous, short-lived and safe to sample, because you want a representative picture of what the system is doing this week. Lineage cannot be sampled, because the record you get asked about is always the one you dropped. A ninety-five percent sample of lineage is a system that can't answer the question ninety-five percent of the time, which in practice means a system nobody trusts and therefore nobody consults.
That's why lineage usually belongs beside the record in your own storage rather than in a telemetry vendor's pipeline. It's small if you keep shapes rather than payloads, it wants the same lifetime as the data it describes, and it's queried in joins against your own tables. Sending it to a system optimised for high-volume short-retention traces gets you the wrong retention, the wrong cost profile and the wrong query surface, all at once.
Correlation, and the cascade nobody traced
A modern system isn't one program. An ingestion pipeline touches three external APIs, two databases, a queue and several services hidden behind abstractions that were designed specifically so you wouldn't have to think about them. Each component has its own state, its own deployment cadence and its own inventive ways of failing.
The chain, and where it presents
Failures in that shape have a property that makes them uniquely hard: they present at the end of a chain and originate at the start of it, and every link in between looks locally reasonable.
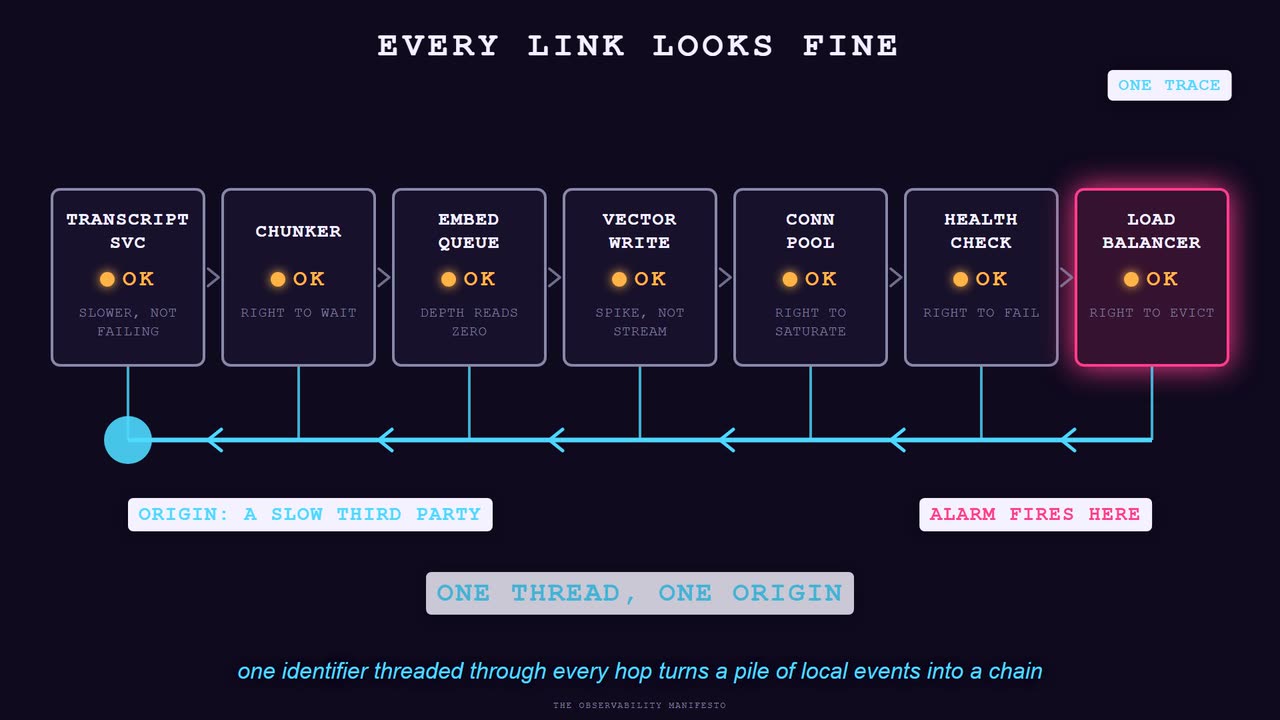
Walk one. A transcript service gets slower without failing. The chunking stage that consumes it backs up, because it's waiting on input. The embedding queue drains and sits empty, so a dashboard watching queue depth shows a reassuring flat line at zero. Then the transcript service recovers and delivers a backlog at once, so chunking bursts, so embedding bursts, so writes to the vector store arrive in a spike rather than a stream. The connection pool saturates under the spike. Health checks share that pool, so a health check times out. The load balancer takes the instance out of rotation. The remaining instances take its share of a burst that was already at the edge of capacity.
What pages somebody is the load balancer removing healthy instances. What caused it was a third party being slow eleven minutes earlier. And every intermediate component behaved exactly as designed: the chunker was right to wait, the pool was right to saturate, the health check was right to fail, the balancer was right to evict. The story has no bug in it, only a chain that nothing wrote down.
One identifier, threaded through every hop
The mechanism that makes the chain reconstructable is unglamorous. An identifier is created at the outermost entry point and propagated through every subsequent operation, across process boundaries, across the queue, into and back out of every downstream call.
In OpenTelemetry this is context propagation and it's mostly automatic once the SDK is wired: the trace identifier travels in request headers, gets picked up by the receiving service's instrumentation and re-attached to spans created there. The parts that aren't automatic are the ones worth attention, and they are the same three every time. Asynchronous boundaries lose context unless you carry it deliberately, so a job pushed onto a queue must carry the trace identifier in its payload or its headers, and the worker must re-establish it on pickup. Manually-created threads and task pools lose it for the same reason. And any hop through a component you didn't instrument breaks the chain at that point, permanently, for that request.
The payoff is that a complaint becomes a lookup. Somebody says search was slow at half past two. You find one trace and read it downward: search was slow because vector similarity was slow, because the query embedding took an unusual time, because the model endpoint was throttling, because a backfill job nobody remembered was running against the same quota. That chain took four hops and no guessing, and every hop was recorded at the time by the component that experienced it.
Error genealogy, which is not a stack trace
A stack trace tells you where a program was when it gave up. That's one frame of a much longer story, and in a distributed system it's usually the least informative frame available, because the place a failure surfaces is generally somewhere far from where it started.
Error genealogy is the practice of recording an error's whole ancestry rather than its last moment. The record holds the whole sequence behind "vector write failed": a user action triggered an analysis, which requested an enrichment, which called a model endpoint, which was throttled, which caused a retry, which arrived during a spike, which exhausted a pool, which failed a write. Each of those is a real event that a real component observed and could have recorded.
Getting it in practice takes three habits, and they are cheap:
- Attach the error to the span where it occurred, with its type as a distinct attribute, rather than logging it as text somewhere adjacent. A type you can group by lets you count error classes; a message you can only read lets you count nothing.
- Record the fact that a call failed at the caller as well as the callee. The callee knows what went wrong internally. Only the caller knows what it was trying to accomplish, and the second fact is usually the one that explains the impact.
- Record retries as span events rather than as separate spans or as silence. A retry that eventually succeeds is invisible in status, and duration is the only place it shows up, which makes "successful after four attempts" indistinguishable from "slow", and those two need completely different responses.
Retry logic exists to hide transient failure from the caller, and it does its job well enough that a system can degrade substantially while every dashboard stays green. The retry count is one of the highest-signal attributes you can put on a span, because a rising retry rate is a failure that has not surfaced yet, and it's the earliest warning most systems are capable of producing.
The same thread across separate products
Once more than one product runs on shared infrastructure, propagation stops being an internal convenience and becomes the only way to see the system at all.
When a knowledge product's extraction runs slower every Tuesday and nobody in that team can explain it, the explanation may not be in that product. It may be that a second product on the same network runs a scheduled analysis on Tuesdays against a shared model quota. Neither team can see that from their own dashboards, because each team's dashboard is scoped to their own service and shows a slowdown with no local cause. Correlation across products reveals contention that is structurally invisible to every individual product, and the cost of getting it is agreeing on one header and honouring it everywhere.
The quota economy
Every system that talks to something it doesn't own is spending a budget. API quota, token allowance, rate limit, concurrency slot, monthly request cap. Managing that budget without instrumenting it is the same activity as managing a bank account by feel, which is technically possible and ends in a conversation you didn't schedule.
Meeting a limit as a wall
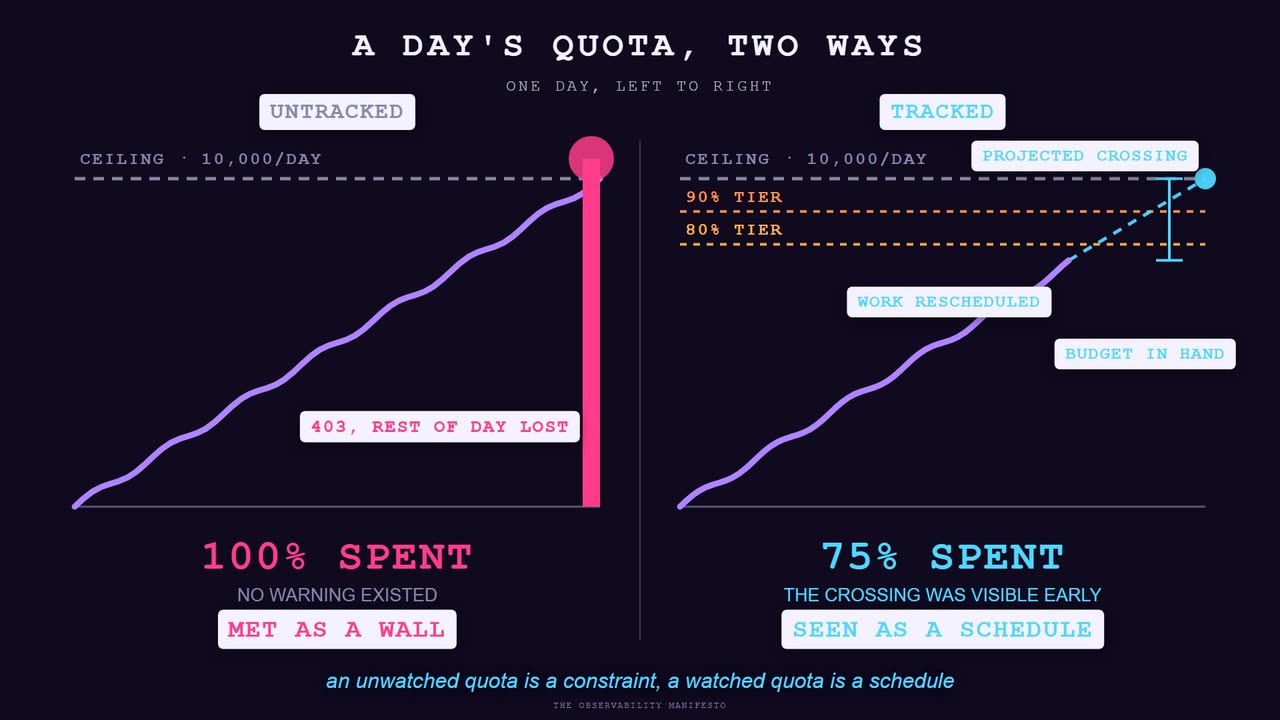
The YouTube Data API allocates ten thousand quota units per project per day. That sounds generous until you look at what operations cost. A cheap read is a unit. A search costs a hundred. Some write operations cost fifty. Ingesting a channel's full catalogue means a sequence of paginated calls, each of which spends.
Untracked, the first signal you get is a 403 with a quota message, arriving at whatever hour your workload happened to cross the line. There's no warning because nothing was counting. There's no partial degradation because a quota is a cliff rather than a slope. And the recovery is waiting for a reset rather than fixing anything, which means the practical response to hitting a quota wall is to lose the rest of the day.
What makes it worse than an ordinary outage is that it was entirely predictable and nobody was in a position to predict it. The information needed to see it coming existed inside your own process, in the form of every call you made. It was simply never written down.
What the instrumented version knows
Tracking quota properly means recording consumption per operation against a known ceiling, and deriving three things from it that the raw count doesn't give you.
| DERIVED VALUE | WHAT IT ANSWERS | WHAT IT LETS YOU DO |
|---|---|---|
| Fraction consumed | how much of today is gone | tier warnings well before the ceiling rather than an error at it |
| Burn rate | how fast it is going right now | project the crossing time and act while acting is still cheap |
| Cost per unit of work | what one ingested item actually costs | capacity planning in items rather than in requests |
| Consumption by caller | which job or feature is spending it | attribute a spike to the thing that caused it in one query |
The last row is the one that turns an incident into a sentence. A quota spike with no attribution produces an investigation. A quota spike broken down by calling job produces the observation that a manual backfill someone kicked off consumed sixty percent of the day's allowance in twenty minutes, which is a complete diagnosis and requires no further work.
Consumption has a shape, and the shape is optimisable
Once the numbers exist for a few weeks, something more useful than alerting appears. Consumption has a daily and weekly shape, and the shape is nearly always worse than it needs to be.
Maybe a third of the day's allowance goes between two and four in the afternoon because that is when scheduled ingestion runs, and the schedule was chosen by whoever wrote the cron line, based on nothing. Maybe Wednesdays are heavy because that is when the sources you follow tend to publish. Neither of those is a problem in itself, and both are levers once they are visible. Non-urgent work moves to the trough. Batch sizes get tuned to the actual cost per item rather than to a guess. Work that competes with itself gets separated.
An unwatched quota is a constraint. A watched quota is a schedule. That's the entire difference, and the only input needed to cross it is a counter and a ceiling.
The same shape for anything you rent
Quota is the clearest example because the ceiling is published and the arithmetic is unambiguous, but the pattern generalises to every consumable a system depends on and doesn't control: model token allowances, concurrent connection limits, storage tiers with retrieval charges, rate limits on a payment processor, and a contracted monthly volume that costs a penalty above the line.
Each one has the same three components: a ceiling you did not choose, a consumption rate you do control, and a failure mode that is a cliff rather than a slope. Each one is invisible by default, because the thing enforcing it is on the other side of a network boundary and has no reason to tell you where you stand until you have arrived. And each one becomes manageable through exactly the instrumentation described here, which is a counter per operation, a known ceiling, and a projection.
The habit worth forming is smaller than a system. When you write the call to something you rent, write down what it cost you in the same breath. Doing it at the moment of the call is nearly free. Reconstructing it afterwards from a vendor's billing export, at monthly granularity, with no attribution to the job that spent it, is a project.
Knowing you are slow before your users do
A duration without context is a number screaming into a void. Three point seven seconds. Is that good? Bad? Normal for a Tuesday? The number is only meaningful against a model of what normal looks like, and building that model is most of what performance monitoring actually is.
The average describes nobody
Average response time is the most commonly reported performance number and one of the least informative, because it collapses the only dimension that mattered.
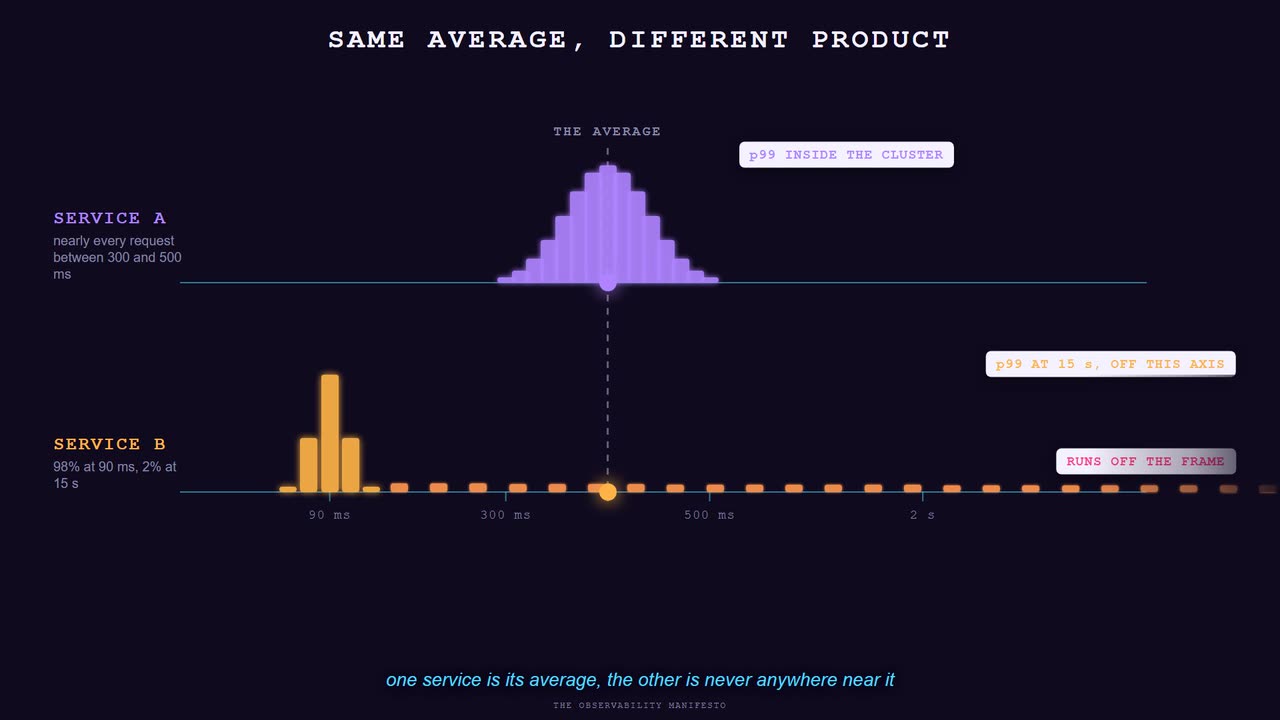
Consider two services that both average four hundred milliseconds. The first serves nearly every request between three hundred and five hundred, tightly clustered. The second serves ninety-eight percent of requests in ninety milliseconds and two percent in fifteen seconds. The averages match and the products are completely different. The first feels consistent and slightly sluggish. The second is fast almost always and catastrophically broken for one user in fifty, and that user is disproportionately likely to be the one with the most data, meaning your worst experience is reliably delivered to your largest customer.
The distribution is the thing. A percentile is a claim you can act on because it names an experience someone actually had. A ninety-fifth percentile of two seconds says one request in twenty took at least two seconds, and that request belonged to a person. A ninety-ninth percentile says the same about one in a hundred. At sufficient volume the ninety-ninth percentile describes thousands of people a day, and they are the population that writes the reviews.
The pattern hiding inside "sometimes it is slow"
Distribution data changes the class of question you can ask. Without it, the report you receive is "transcript fetching is sometimes slow", which isn't actionable because it's not a description of anything specific.
With per-operation durations and enough attributes attached, the same report becomes a shape. Most calls land between two hundred and four hundred milliseconds. Roughly one in fifty takes over two seconds. Group the slow ones by any field you recorded and see whether they share something. If they all carry a content length above a threshold, you have found a pagination boundary nobody documented. If they cluster by hour, you have found contention. If they cluster by region, you have found a network path.
The move that makes this work is the one from the cardinality section: the slow requests are only separable from the fast ones by fields you recorded on each individual request. A percentile chart tells you a tail exists. Only the attributes on the events in that tail tell you what the tail is made of, which is the difference between knowing you have a problem and knowing what it is.
Degradation is a slope, and thresholds cannot see slopes
The failure mode I find most expensive is the one nobody notices, because it never crosses anything.
Software doesn't usually get slower all at once. An endpoint takes a hundred milliseconds in January. In February it takes a hundred and twenty, because a table grew and a query that never had an index now sometimes scans. Nobody notices twenty milliseconds. In March it's a hundred and fifty. In April, one hundred and ninety. By September it's five hundred, which is five times the original, and at no point did any single month's change look like anything worth investigating.
Then somebody joins the team, uses the product, and says it feels slow. And there is no incident to point at, no deploy to blame, no alert that fired, because a threshold alert is a detector for events and this was never an event. It was a slope, and the only instrument that sees a slope is one comparing a value against its own history over a long enough window.
Practically that means keeping a long baseline at coarse resolution alongside your high-resolution recent data. You don't need per-second granularity from eight months ago. You need the daily ninety-fifth percentile per operation, which is a handful of numbers per day per endpoint, cheap enough to keep for years, and sufficient to answer the only question that matters here: is this operation slower than it was, and since when.
The two instruments answer different questions and you need both. A threshold tells you something is wrong right now. A trend tells you something has been getting worse for two quarters. Almost every team has the first and almost none have the second, which is why so much performance work is archaeology performed under pressure rather than maintenance performed on a schedule.
Where the boundaries actually come from
One more note on the duration categories from earlier, because the temptation is to set them per service based on what that service currently does, which quietly encodes today's performance as the definition of correct.
The useful boundaries come from the person waiting, and they have been stable for as long as people have studied interactive systems. Around a tenth of a second, a response stops feeling instantaneous and starts feeling like a response. Around one second, attention drifts off the task and has to be brought back. Past several seconds, people conclude the system is broken or gone, and they either leave or start clicking things again, which in a system without idempotency is its own category of problem.
Anchoring your categories there rather than to your current numbers has one important property: the boundaries do not move when your system gets slower. A service whose thresholds are derived from its own recent behaviour will always report itself as normal, because normal is defined as whatever it has been doing lately. That's a monitoring system that has been quietly configured to agree with you.
Five steps at ninety percent is not ninety percent
One piece of arithmetic changes how a workflow looks once you've seen it.
The product rule
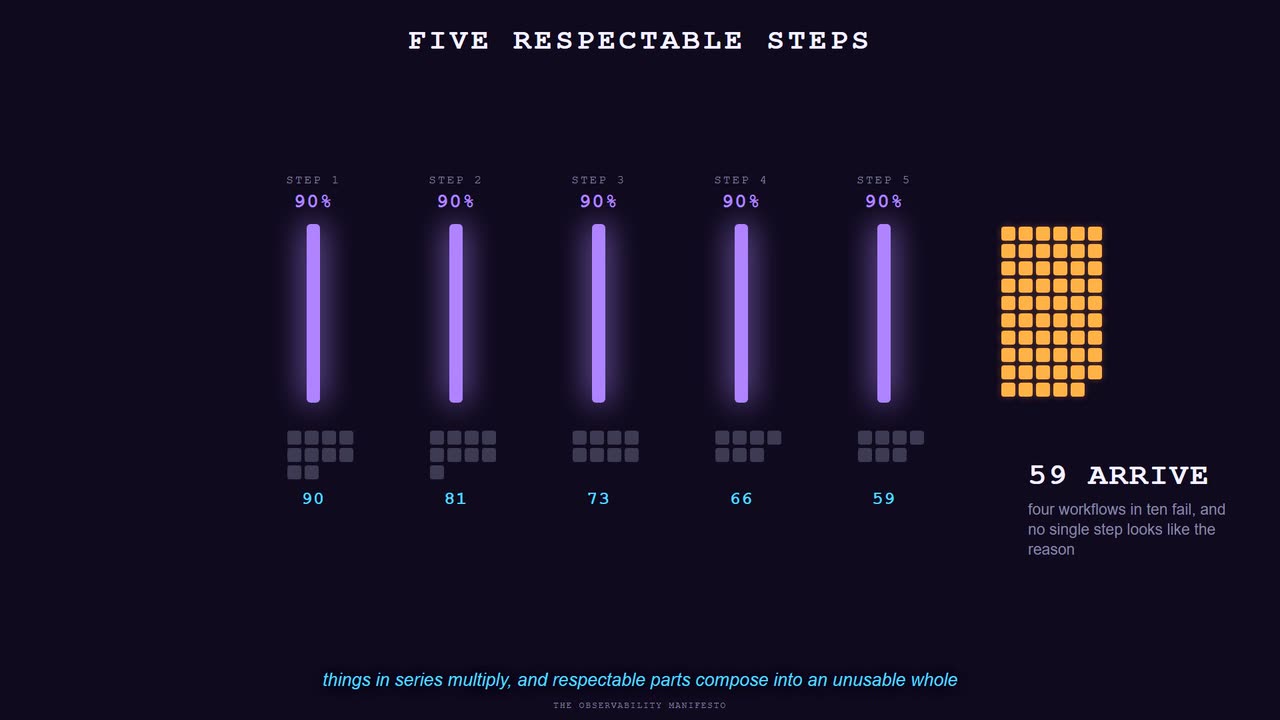
A workflow has five steps, and every step must succeed for the workflow to succeed. Each step works ninety percent of the time, which sounds respectable and is the sort of number a team would report without embarrassment.
For independent steps, the workflow's success rate is the product:
0.9 × 0.9 × 0.9 × 0.9 × 0.9  =  0.590

five respectable steps  →  four workflows in ten fail
Five components nobody would call unreliable compose into a workflow that fails two times in five. This is the ordinary behaviour of things arranged in series, and it's the reason a system can be built entirely out of parts that each look fine and still be unusable end to end.
What this is called, so you can go read more about it
A series system in reliability engineering is one that functions only if every component functions, and its reliability is the product of the component reliabilities under an independence assumption. The broader discipline is reliability block diagram analysis, which models a system as components in series and parallel and computes the whole from the parts. It predates software by decades and comes from engineering domains where getting this wrong killed people.
Components in parallel are the counterpart. Where any one succeeding is enough, they multiply their failure probabilities instead, so redundancy improves reliability at the same rate that chaining degrades it. A retry with a genuinely independent failure mode is a parallel arrangement, which is exactly why retries help so much and also exactly why a retry against a dependency that is entirely down helps not at all.
Where the assumption breaks, and which direction it breaks in
The product rule assumes the steps fail independently. Real distributed systems violate that constantly, and it matters that you know which way the violation runs, because people tend to assume it runs in their favour.
- Shared dependencies. Three of your five steps talk to the same database. When it degrades, three steps fail together. Their failures are correlated, not independent.
- Correlated load. A traffic spike pressures every step at once. Queue depths rise together, timeouts fire together.
- Retry coupling. A failure in one step generates retry traffic that adds load to the next, so one step's bad minute causes another step's bad minute.
- Shared configuration and deployment. One misconfigured value or one bad release affects every component that reads it, simultaneously.
Every one of those is a positive correlation between failures. Positive correlation between failures makes the real system worse than the independent product, not better, because failures arrive together in the periods where you can least afford them rather than spreading evenly across a comfortable average. So 0.59 is the optimistic figure, and real-world nuance makes it worse rather than softening it.
Why this is an argument about instrumentation
You measure the workflow end to end and find it succeeds fifty-nine percent of the time. That number tells you that you have a problem and tells you nothing whatsoever about where it is.
The five steps might each be at ninety percent, in which case the work is spread evenly and there is no shortcut. Or four of them might be at ninety-nine percent and one at sixty-two, which produces roughly the same end-to-end figure and implies a completely different plan. The endpoint measurement cannot distinguish those two worlds, and they are the only two facts about the workflow worth having.
Per-step instrumentation resolves it immediately. Each step records its own success and failure. The per-step rates fall out of a query. The weak link names itself, and so does the second-weakest, which is the one you fix next.
There's also a corollary about ambition. Improving a step from ninety percent to ninety-five is worth roughly the same amount, in end-to-end terms, wherever you do it. But improving the worst step from sixty-two to ninety is worth an enormous amount more than improving an already-good step, and you can't see that opportunity at all without per-step numbers. Uninstrumented reliability work is optimisation by intuition, and intuition consistently picks the step that is easiest to reason about rather than the step that is costing you the outcome.
Watching costs something, and here is what
There's a philosophical version of this section that invokes the observer effect and notes that measuring a system changes it. That framing is true, unhelpful, and has been used to justify both far too much instrumentation and far too little. The useful version is arithmetic.
The measured range, stated as a range
Instrumentation isn't free. Every span allocates objects, serialises attributes and eventually crosses a network. Published benchmarks and vendor performance guidance vary by language, framework and configuration, and the responsible summary is a range rather than a figure:
| DIMENSION | TYPICAL WITH SANE CONFIG | WHAT PUSHES IT HIGHER |
|---|---|---|
| CPU | roughly 5 to 20 percent additional | a span per internal function; very large attribute sets |
| Latency | sub-millisecond to a few milliseconds per request | synchronous export, frequent flushes, blocking the event loop |
| Memory | tens to low hundreds of megabytes per process | deep batching, long export queues, retained payloads |
Read these as a range, because that's what the evidence supports. Dynamic runtimes tend to sit higher in the CPU band than compiled ones for equivalent instrumentation, and pathological configurations exceed the band entirely. Treat these as the shape of the cost to plan against, then measure your own; the one number that matters for your system is the one you take from your system.
Two configuration choices account for most of the variance, and both are decided once:
Export asynchronously and in batches. A synchronous exporter puts a network round trip inside your request path, which converts a background cost into user-visible latency and does it on every single call. Batched asynchronous export moves the same work off the critical path. It's a default in mature SDKs and it's also a default people override while debugging and forget to restore.
Instrument boundaries and transformations, not every function. This is the same judgment from earlier, arriving again as a cost argument rather than a clarity argument. The instrument-everything approach is the main way teams end up in the twenty-plus percent range, and it's also the approach that produces traces nobody can read. The expensive version and the useless version are the same version, which is a convenient thing when you're arguing about it.
Sampling, and what each kind cannot do
You can't keep every span from a high-volume system at a price anyone will sign off. Sampling is how the discipline settles that, and there are two kinds with different properties.
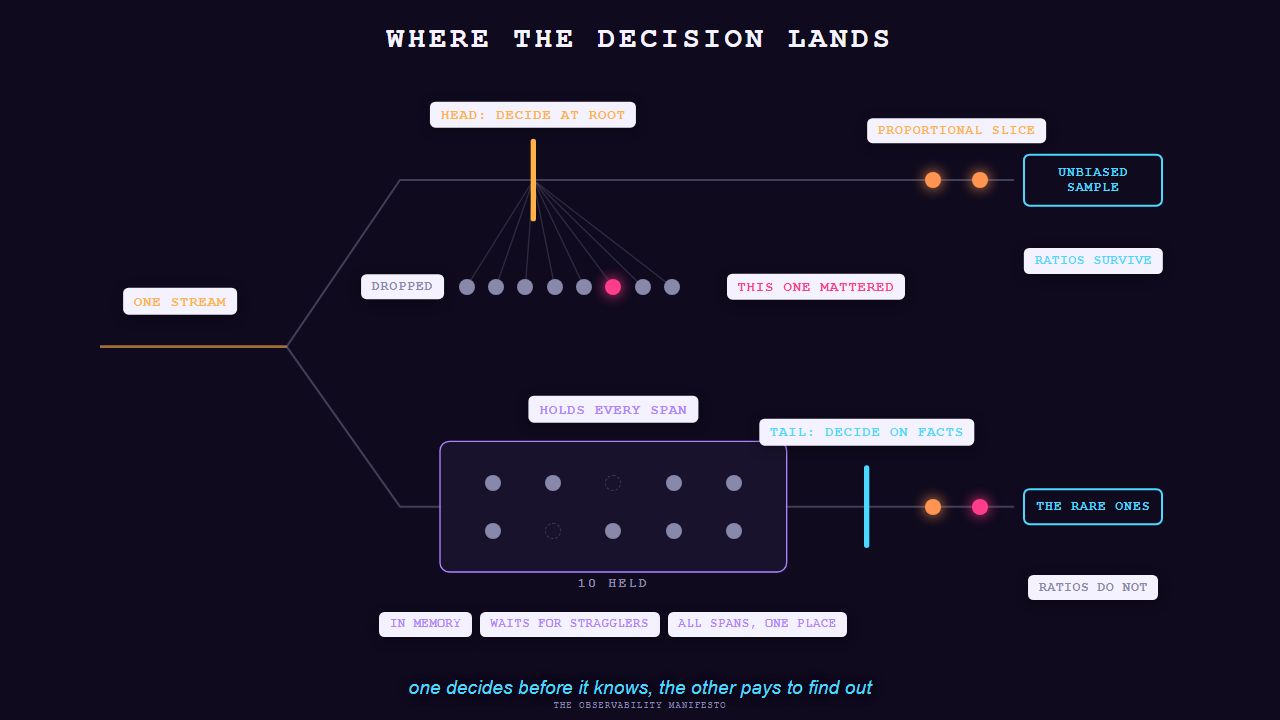
Head sampling decides at the root of the trace, before any work happens, and propagates that decision so a trace is kept whole or dropped whole. It's cheap because nothing you drop is ever serialised, buffered or transmitted. Its structural limitation is that it decides before it knows anything. A trace dropped at the head can't be recovered when it turns out to have been the interesting one, so rare and valuable events are kept only at the same rate as everything else.
Tail sampling collects spans, buffers them until the trace looks complete, and then decides based on what actually happened: keep everything with an error, keep everything over a latency threshold, keep a small percentage of the rest. It gets you exactly the traces you want to look at.
Its requirements are where the difficulty lives, and they are worth knowing before you commit to it. The collector's tail-sampling processor must buffer spans per trace in memory, must wait a decision interval for stragglers, and must see every span of a trace at the same place to judge it. That last requirement is the one that breaks first. Spans for a single trace originate in different services, on different nodes, in different regions, and if your collectors are sharded or regional then a given collector sees a partial trace and decides on incomplete information. Making it correct at scale means sharding by trace identifier and accepting the hot-key skew that comes with it, or centralising telemetry and paying the latency and egress for that.
The mistake that makes your reliability numbers wrong
This mistake is easy to make while you're doing everything else correctly.
Head sampling, done as unbiased random selection, preserves proportions. A five percent sample of traffic has approximately the same error rate and approximately the same latency distribution as the full population, within sampling error that shrinks as your window grows. You lose exact counts and you keep ratios, which means head sampling is compatible with measuring service level objectives, since objectives are ratios.
Tail sampling deliberately does the opposite. A policy that keeps every error and five percent of successes produces a stored population where errors are twenty times over-represented. That's exactly what you want for debugging, because the stored traces are the interesting ones. It's catastrophic as a source of truth for reliability numbers, because computing an error rate over a deliberately biased sample gives you a wrong number that looks entirely plausible, and a plausible wrong number is worse than an obviously missing one.
The rule: compute objectives from unbiased data, and investigate from selected data. In practice that means service level indicators come from metrics or from an unbiased head sample, tail-sampled traces are for looking at, and nobody ever computes a percentage over the tail-sampled set. Every team that has confidently reported reliability improving while users reported it worsening has made a version of this mistake.
As for rates, common production practice for generic traffic lands somewhere in the low single digits to around ten percent, with specific high-value paths kept at full rate and error paths up-sampled by tail policy. There's no correct number, and the way to find yours is to ask what the smallest sample is that still answers your questions at your traffic volume, which is a different answer for a service handling a thousand requests a day than for one handling a billion.
What it costs in dollars, and why the pricing model fights you
The usual argument for instrumentation is that ignorance costs more than telemetry. It's a good argument and it gets made badly, with invented arithmetic that a finance person can dismantle in one question. So let me separate what is illustration from what is evidence, and say clearly which is which.
The arithmetic everyone quotes, labelled as arithmetic
A production issue occurs. Without instrumentation you reproduce, add print statements, deploy, wait, repeat, and find it three hours later. With it you open the trace, see the failing span with its inputs and its state, and fix it in half an hour. At a loaded engineering cost of a hundred and fifty dollars an hour, that is four hundred and fifty dollars against seventy-five, plus a few dollars of storage.
That comparison is arithmetic on assumed inputs, and it is worth exactly what its assumptions are worth. I'm stating it because it's the calculation people actually run in their heads, and stating it plainly beats letting it operate unexamined. The hourly rate is a guess. The three hours is a guess. The thirty minutes is a guess. Multiply three guesses and you have produced a number with the appearance of a finding and the substance of an anecdote.
Specifically: the three-hours-becomes-thirty-minutes ratio is not a published measurement. I have looked for one. It's a plausible story that matches my experience and the experience of most people who have worked both ways, and it's not evidence, and this entry doesn't get to present it as evidence.
What is actually measured
The rigorous finding is less dramatic and more useful. Research into software delivery performance, most consistently the DORA programme, tracks four outcome measures including mean time to restore and change failure rate, and finds that teams in the highest-performing cohorts consistently practise comprehensive monitoring and observability alongside continuous delivery and loosely coupled architecture.
The shape of that finding matters. It's an association across a bundle of correlated practices, measured at team level over years. It is not an isolated causal effect size and nobody should quote it as one. What it supports is the statement that observability is a practice of teams that restore service faster, which is worth having and is a weaker claim than the one usually made. What it doesn't support is a specific percentage improvement attributable to instrumentation alone, and any vendor offering you that number computed it from assumptions rather than from measurement.
Per-gigabyte pricing taxes the exact thing that works
Observability bills surprise people because most vendors charge by data ingested, by events, by time series retained, or by some blend.
Each of those charges scales with the property this entry has spent ten thousand words arguing for. A wide event costs more than a narrow one, for the same operation, in direct proportion to how useful it is. Every attribute you add because it might answer a future question is bytes on the wire, bytes on disk, and index entries to maintain.
So the pricing model and the practice point in opposite directions:
| WHAT IT DOES FOR YOU | WHAT IT DOES TO THE BILL | |
|---|---|---|
| Low-cardinality metric | answers a question you chose in advance | nearly free, and stays nearly free |
| Narrow span | tells you where the time went | moderate, scales with traffic |
| Wide high-cardinality event | answers questions invented later | expensive, and scales with traffic and width |
That opposition resolves something that otherwise looks like an inconsistency in the whole field. If wide events are better, why hasn't everyone abandoned metrics? Because low-cardinality metrics survive on price rather than on merit. They are orders of magnitude cheaper, they are entirely sufficient for control loops, autoscaling signals and objective tracking, and no argument about dimensionality changes that. Metrics are the cheap guardrails you leave on everywhere. Wide events are the expensive power tool you point at the places where you expect to need answers you can't predict.
Reported cost composition follows the same logic: traces typically dominate an observability bill at something like sixty to seventy percent, logs take twenty to thirty, and metrics take five to ten. The cheapest signal is the one everybody keeps everywhere, which is exactly what the pricing incentive would predict.
What organisations actually spend
There's enough survey and analyst data here to stop guessing. The figures cluster, and the clusters are worth knowing because they let you place your own bill on a distribution instead of arguing about it from first principles.
- Median observability spend runs roughly 7 to 12 percent of total cloud and infrastructure spend, with monoliths at the low end and multi-region microservice estates at the high end.
- Well-instrumented teams commonly sit at 15 to 25 percent. Honeycomb has published in this band across several years, revising slightly downward over time.
- Outliers reach 30 to 50 percent, and at that point observability is a first-order budget line being managed by whoever notices it first.
- At enterprise scale the absolute numbers get large. Gartner has reported that a substantial minority of its clients spend over a million dollars a year on observability and a small fraction spend over ten million, with logs taking the majority of it. Individual vendor disclosures of eight-figure annual customer bills have been reported publicly. These are secondhand reports of analyst and vendor figures rather than numbers I have verified, and they are worth treating as an order of magnitude rather than a measurement.
I'd defend two conclusions from those figures. First, if your observability bill is a low single-digit percentage of infrastructure, the likely explanation is under-instrumentation rather than efficiency, and the missing spend is being paid somewhere else in engineering hours that nobody attributes to it. Second, if it's above thirty percent, the problem is almost never that you're watching too much and almost always that you're watching indiscriminately: full payloads captured, debug logs shipped at production volume, retention set once at a default and never revisited.
Both point at the actual discipline, which is the same design judgment as everywhere else in this entry. Decide what questions this system will need to answer, instrument for those, keep the dimensions that answer them, and drop the rest at the edge before you pay to move it. A team that has never made that decision explicitly is paying for one that got made by default, in a config file, by whoever set it up.
The pattern language
What accumulates from all of the above is a vocabulary for describing what a system is doing, and vocabularies travel better than implementations. Each pattern in that vocabulary has shown up in every observable system I've worked on, in different languages against different backends, which is the test for whether something is a pattern or a habit.
Nine patterns, and where each one shows up again
| PATTERN | WHAT IT DOES | THE SAME SHAPE ELSEWHERE |
|---|---|---|
| Decorator | wraps an operation so it reports on itself without knowing | web middleware, render pipeline stages, transaction interceptors |
| Checkpoint | captures state and parameters at a stage boundary | transaction boundaries, validation gates in training pipelines, save points |
| Metrics aggregation | turns individual measurements into a model of normal | frame-time percentiles in a game loop, confirmation-time distributions on chain |
| Correlation | one identifier ties distributed events into one story | player session tracking, transaction genealogy, request tracing |
| Health check | a status surface that names every dependency, not just OK | readiness probes, preflight checks, dependency dashboards |
| Trace propagation | every service accepts and forwards the context headers | baggage propagation, message envelope metadata, causal ordering |
| Metrics taxonomy | consistent naming so one dashboard works across services | semantic conventions, schema registries, shared ontologies |
| Error genealogy | records an error's whole ancestry, not its last frame | causal chains in post-mortems, root cause trees, fault trees |
| Performance budget | a declared limit per surface that instrumentation enforces | frame budgets, bundle size budgets, error budgets |
The right-hand column is doing the real work in that table. These aren't observability patterns that happen to resemble things elsewhere. They are general patterns for reasoning about processes over time, and observability is one domain where they happen to be written down. That's why the vocabulary transfers when you change stack, and why an engineer who has internalised it arrives at a new system already knowing what to look for.
The two that are pure discipline
Seven of those are techniques. Two of them are agreements, and agreements are harder, because they cost nothing to implement and everything to maintain.
Metrics taxonomy is the agreement that every service names things the same way. It can be a structure as simple as service, then operation, then measurement, applied without exception. It buys you something that sounds small and is enormous: one dashboard definition works against any service, one alert rule generalises, and an engineer moving between systems doesn't have to relearn where things are. It costs the discipline of writing a name in a shape somebody else chose, on a Tuesday, when your own name felt more natural. Teams lose this one incrementally, one reasonable exception at a time, and by the time anybody notices there are four conventions in production and a translation layer that nobody wants to own.
Performance budget is the agreement that a limit is a contract rather than an aspiration. A page loads under two seconds. An API responds under two hundred milliseconds. A pipeline stage completes under thirty. The distinction from a guideline is entirely in what happens when it's exceeded: a guideline produces a conversation, a budget produces an alert against a number that was agreed in advance and is now being violated in public. The value is in fixing the threshold before you have an emotional stake in whether it was crossed, which is the same reason you write a hypothesis down before you look at the data.
Health checks that are worth calling
Almost every health endpoint I encounter is useless, and useless in the same specific way.
An endpoint returning {"status": "ok"} confirms that the process is running and can serve a response. That's a useful fact, and it's roughly two percent of what you want to know. The service can be running perfectly, answering health checks in a millisecond, and be entirely unable to do its job because a dependency it needs is unreachable.
A health check worth having enumerates dependencies and reports each one's state: the databases it needs, the external APIs it calls, the model endpoints it depends on, the queue it consumes from, whether it has warm caches and current configuration. The failure a shallow check misses is the one where the service is healthy and useless, which is also the most common failure in a system built out of services. Load balancers make it worse by treating the shallow check as authority, keeping an instance in rotation to serve requests it will fail, and doing it confidently.
Separation is what makes a system observable at all
Everything so far has treated architecture as given. It isn't, and the relationship runs from the architecture to what you can see: an architecture determines what can be observed about it. A system with no internal boundaries has nowhere natural to put a span, so every instrumentation decision is arbitrary and every trace is an arbitrary slice of a continuum.
Splitting along fault lines that already exist
The split I keep arriving at is three services along lines that were already in the mental model before any code enforced them.
A frontend cares about experience: response time, interaction smoothness, whether anything looks broken. A backend cares about contracts: data integrity, API stability, not losing information. A core cares about computation: accuracy, throughput, not burning cycles on work that didn't need doing.
Those are three different concerns with three different optimisation pressures, three different scaling profiles and three genuinely different failure modes. The conventional advice is to start with one program and split later when the pressure justifies it, and that advice, sound as far as it goes, undercounts the cost of the split. Separating a system that has run in production for a year means untangling a schema that two halves both depend on, while both halves are live.
What the separation buys immediately, before any scaling argument applies, is boundaries with meaning. The frontend can't reach the database, so every data access crosses an API you can instrument. The core doesn't serve web traffic, so every heavy computation is triggered through a path you can count. Those constraints look like limitations from inside and behave like guardrails from outside, and the instrumentation they enable is a side effect nobody plans for and everybody uses.
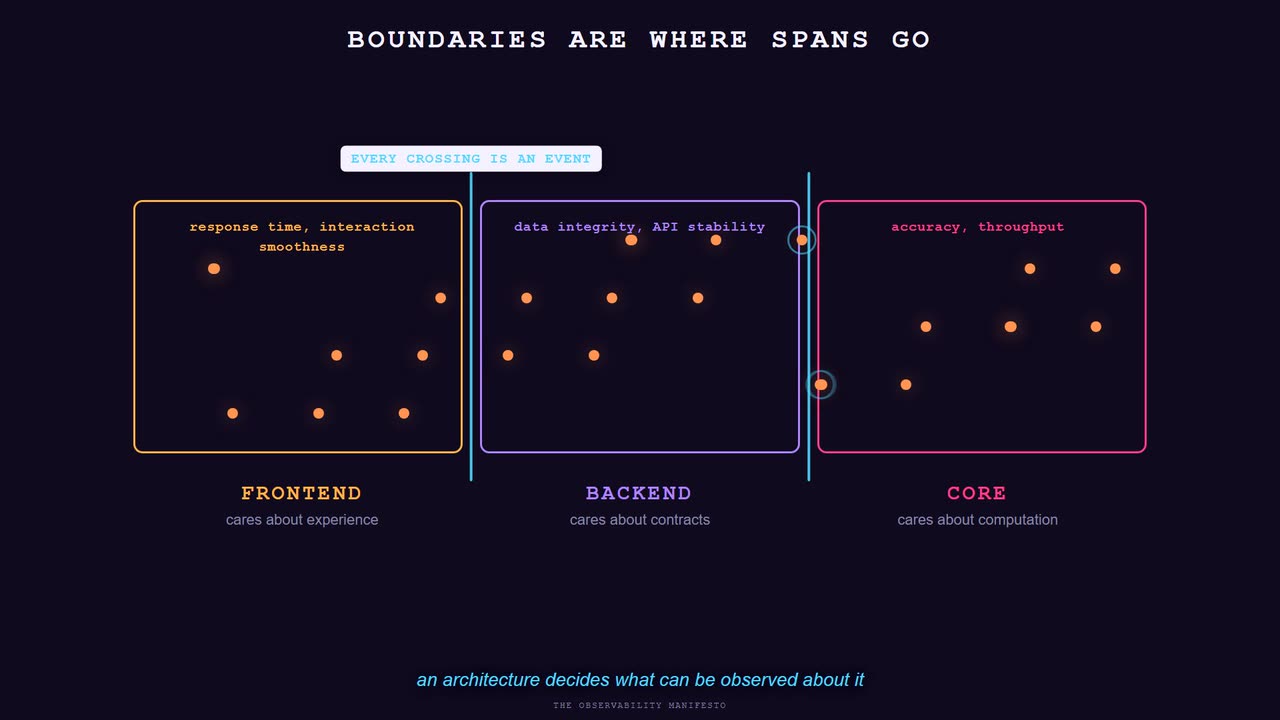
Each zone answers a different question
The separation also fixes something subtler, which is that a single service forces one observability strategy onto three concerns that want different ones.
| ZONE | CHARACTER | WHAT ITS TELEMETRY IS FOR |
|---|---|---|
| Backend | stability zone. Slow, deliberate, contracts are sacred. | reliability. Uptime, response time, error rate. Deliberately boring. |
| Core | innovation zone. New models, new strategies, fast iteration. | performance and correctness. How fast, how good, how much it cost. |
| Frontend | experience zone. Most volatile, because people are. | behaviour. What they clicked, where they stalled, when they left. |
Different deployment strategies follow directly. The backend can ship weekly with careful rollout because its contracts are load-bearing for everyone else. The core can ship daily with automatic rollback on a performance regression, because its interface is narrow and its regressions are measurable. The frontend can ship continuously behind flags. Each cadence is safe only because the telemetry for that zone can detect that zone's kind of failure, and a single deployable forces all three onto whichever cadence the most fragile part can tolerate.
The same idea as entities and components
There's a reading of this that comes from game engines and is worth carrying, because it makes the pattern portable to problems that aren't service architecture.
In an entity component system, an entity is an identity with no behaviour, components are data attached to it, and systems are functions that operate over everything carrying a given component. Read the architecture that way and each service is an entity, its capabilities are components, and the interactions between them are systems. Adding a pipeline type means adding a component rather than modifying the entity. A capability that two services both need is one component configured twice rather than two implementations that drift.
The observability layer is itself this shape, which is the detail that convinced me the reading is real rather than decorative. A span is an entity. Its attributes are components. The collector is a system that operates over everything carrying them. The pattern recurs at that many scales because it's a general answer to composing complex behaviour from simple labelled parts, and noticing that saves you from designing a bespoke structure every time the same problem appears wearing different clothes.
Pure in the middle, effects at the edges
In the core, most code can be pure, and that property earns its place here because of what it does for instrumentation.
Chunking takes text and returns chunks. Embedding takes text and returns vectors. Clustering takes vectors and returns clusters. None of those needs to touch the outside world. The side effects, the database writes and the API calls and the file operations, live at the edges in clearly marked places.
That arrangement makes the instrumentation decision fall out of the structure rather than requiring judgment at every function. Pure functions need performance monitoring and almost nothing else, because their inputs determine their outputs, so if you have the inputs and you have the duration you have everything. Re-run it and you get the same answer. Side effects need deep observation, because they involve a system you don't control, they can fail in ways your code can't anticipate, and they can't be re-run to find out what happened.
So the question "what needs heavy instrumentation" has a structural answer instead of a per-case one. Follow the effects. In a codebase where effects are scattered through otherwise-pure logic, that answer is unavailable and every function becomes a judgment call, which is how you end up with either uniform over-instrumentation or uniform under-instrumentation, both of which are the same failure of not having decided.
Watching a system that does not repeat itself
Everything above assumes a system that, given the same input and the same state, does the same thing. Most software works that way. A growing amount doesn't, and the shift breaks an assumption that sits underneath conventional debugging so quietly that most people have never had to notice it.
The assumption you never knew you were leaning on
With a deterministic service, telemetry is a convenience. If you failed to record something, you can usually get it back: re-run the function with the same inputs, attach a debugger, reproduce it locally. The information was recoverable because the behaviour was reproducible.
An agent driven by a language model doesn't offer that. Sampling makes identical inputs produce different outputs. Retrieved context differs because the corpus moved. Tool results differ because the world moved. A provider updates a model behind a stable name. The execution you are asking about happened once and will never happen again, and if nothing recorded what it did, that information has ceased to exist.
That changes the status of instrumentation from good practice to the only record. Everything in this entry gets more load-bearing, and the parts about recording decisions stop being a refinement and become the primary requirement.
The observable artifact is the sequence of choices
For a conventional service, a trace is a call graph: this called that, which called the other, and here is where the time went. For an agent, the call graph is the least interesting part of the record. Two runs can have identical call graphs and completely different behaviour, or wildly different graphs and equivalent outcomes.
What you need is the decision path. That means what context was assembled and from where, what the model was asked and with which parameters, which tool it selected out of those available and what it was given as an argument, what that tool returned, which guardrail evaluated and whether it passed, where control handed off to another agent and why, and what the final action was and what state it left behind.
Practice here has converged on labelling spans by their role in the decision rather than by their position in the call tree: the orchestrating step, the inference step, the tool invocation, the retrieval. That labelling is what lets you ask "how often does this agent pick this tool when the context looks like this", which is the shape of nearly every real question about agent behaviour and is unanswerable from a call graph.
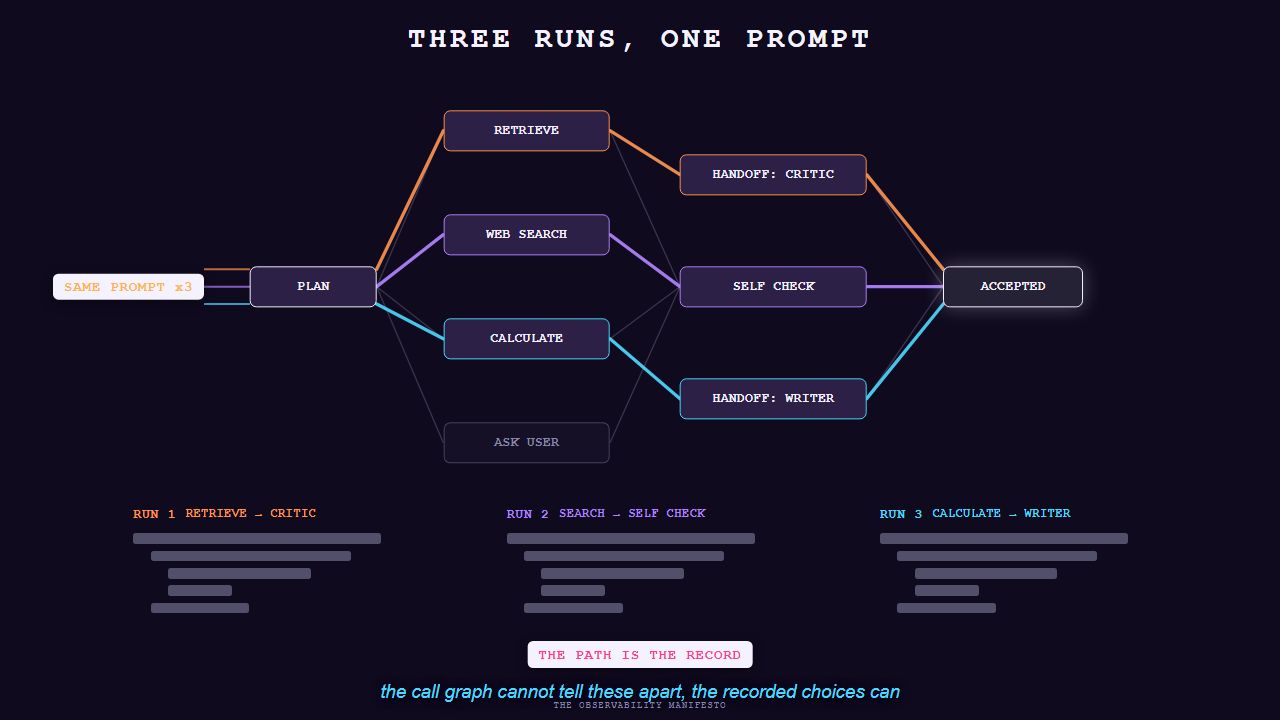
The conventions exist and are not settled
OpenTelemetry has an emerging gen_ai.* namespace for this, and it's worth adopting with clear eyes about its maturity.
The shape is familiar from the rest of the standard. Span names describe the operation class: a chat completion, an agent invocation, a tool execution. Attributes carry the request model, the provider, the operation type, and usage counts for input and output tokens, and metrics cover operation duration. The value is the same value semantic conventions always deliver: a dashboard computing cost by model works across providers, and a query for tool-execution latency returns everything rather than whatever your own naming happened to cover.
These conventions are experimental rather than stable, which is a real difference from the HTTP and database conventions and should change how you build against them. Attribute names may move. Expect to pin what you emit, keep a translation layer at the boundary rather than scattering convention keys through your application, and re-check the specification before you build anything that assumes a key is permanent.
Failure stops being an error and becomes a judgment
The deepest change is what counts as a failure at all.
A conventional service fails by throwing, timing out, or returning the wrong status. All three are mechanically detectable, which is why conventional alerting works. An agent fails by returning something well-formed, delivered quickly, with a two-hundred status, that is wrong. It cited a source that says the opposite of what it claimed. It answered a question adjacent to the one asked. It called the right tool with a subtly wrong argument and reported the result confidently. Every mechanical signal you have says success.
So the telemetry has to carry quality signals alongside the technical ones, evaluated continuously rather than in a test suite before release. In practice that means a layered arrangement:
- A held-out set evaluated before deployment, drawn from the real production distribution rather than from examples somebody wrote, with a merge gate on regression past a tolerance.
- Online evaluation on a sample of live traffic, scoring outputs on dimensions that matter for the task: groundedness against retrieved context, task completion, format compliance, safety.
- Deterministic checks wherever a deterministic check is possible. Schema validation, citation grounding, forbidden-content rules, numeric range checks. These are cheap and exact, and every one of them removes a judgment call from a probabilistic evaluator.
- Drift monitoring on the evaluator scores themselves, because the failure that hurts is a slow slide as inputs shift away from what the system was tuned on, not a sudden break. That's the same slope problem from earlier, in a domain where it moves faster.
- Production traces converted into test cases. Every interesting failure becomes a permanent regression check, which is the compounding mechanism that makes the whole arrangement improve rather than merely report.
Some of this is still unsettled, and this is a field where confident claims outnumber established practice by a wide margin. There's no consensus quality metric, and teams decompose quality into task-specific dimensions because a single score has never survived contact. Using a model to judge another model's output works and requires calibration against human labels to be trusted. And attributing a quality regression back to the specific decision that caused it remains genuinely hard, with tooling that varies by vendor and framework.
The direction is clear even where the details aren't. The question observability answers is moving from "is the system up" to "what did the system decide, on what basis, and was that decision any good". Every practice in this entry points that way, and the systems that are hardest to watch are the ones where it matters most.
Observable is part of the definition of done
The technical arguments in this entry are the easy part. I have never seen a team dispute that traces are useful. I have seen many teams agree that traces are useful, put instrumentation on a roadmap, and still be running a blind system two years later.
The reason it never happens
Instrumentation gets scheduled as its own work item, sitting in a backlog alongside features, migrations and everything else. It loses, every time, because it never has a deadline attached and it never has a customer asking about it. There's always something with a date on it, and there is never a quiet week.
The comparison is documentation, which fails in the same way and for the same reason. Both are things you do after the real work, if there is time, and there isn't going to be time. Both are cheap in the moment when the knowledge is fresh and expensive later, when the person who had the knowledge has moved on and the code has to be re-read to reconstruct it.
Anything scheduled as work that follows the real work does not happen, and anything included in the definition of the real work happens automatically. That's a statement about how backlogs sort under pressure rather than about discipline or seniority, and it's true of every team I have worked with including the good ones.
The second question, asked at the right moment
So the fix is a question, moved earlier.
When a feature gets designed, the first question is what it should do. The second question is how we will know whether it is working. It comes second, not later and not at review. At that moment the answer costs almost nothing, because whoever is designing it already knows which failure modes worry them, which values would be surprising, and which decision inside it is the one that will be argued about. Writing those down as attributes takes a few minutes.
Ask it six months later and it's expensive, because now somebody has to read the code, reconstruct the intent, guess at which branches matter, and instrument from the outside. The information was free once and has to be repurchased.
What that changes in practice is small and specific:
- A design document has an observability section, naming what this feature will emit and which questions that lets someone answer.
- Code review checks instrumentation the way it checks error handling. A pull request that adds a decision branch and no way to see which branch fired is incomplete in the same sense that one with an unhandled error path is incomplete.
- Every post-mortem asks how this could have been seen coming, and the answer becomes a change to instrumentation rather than a resolution to be more careful. This is the mechanism that makes the system improve rather than merely accumulate incidents.
- A feature is not done until it is observable. It's stated plainly and applied without exception, so nobody has to argue it case by case.
What it changes about how a team works
The return compounds in a way that is easy to miss because it shows up as the absence of things.
When every service is instrumented consistently, debugging stops being an individual heroic activity and becomes something several people can do at once, because the evidence is in a shared place rather than in one person's terminal history. When every service reports the same shape of metrics, optimisation becomes possible instead of theoretical, because you can compare across systems rather than argue from anecdote. When every operation is observable, the standing question in an incident channel shifts from "what happened" to "what should we do about it", and those two conversations have completely different costs.
That last shift is the real one. Most of the expensive part of an incident is the period before anyone knows what is wrong, during which several people are guessing in parallel, some of them are guessing wrong, and a few of them are making changes based on those guesses. Instrumentation collapses that window, and the fix itself is usually the same fix either way.
Three in the morning
The argument gets settled outside any design review.
The same page, twice
It's three in the morning and a phone goes off. Something is wrong with an ingestion pipeline.
In the uninstrumented version, that means getting up and connecting to production, then reading logs from several services, each with its own format and its own clock, and doing timestamp arithmetic between them to work out what happened in what order. Then you form a theory and test it by changing something. That's an hour minimum, done badly, by somebody who was asleep twenty minutes ago and will be making decisions about a production system for the next several hours in that state.
In the instrumented version it means picking up the phone without sitting up. Ingestion succeeded for videos and started failing for transcripts at 2:47. Open the failed spans: the transcript service is returning rate-limit responses. Check the quota tracker: consumption spiked at 2:31 when a manual backfill started, and there is a name attached to the job. Silence the alert, queue the work for after the quota resets, and go back to sleep. It takes three minutes, and the diagnosis is complete before any decision needs making.
The system broke in both versions. That's not the variable. Services fail, providers change behaviour, networks partition, and none of that is preventable by watching it. The variable is how long the gap lasts between something breaking and somebody understanding what broke, and understanding is where the hours go.
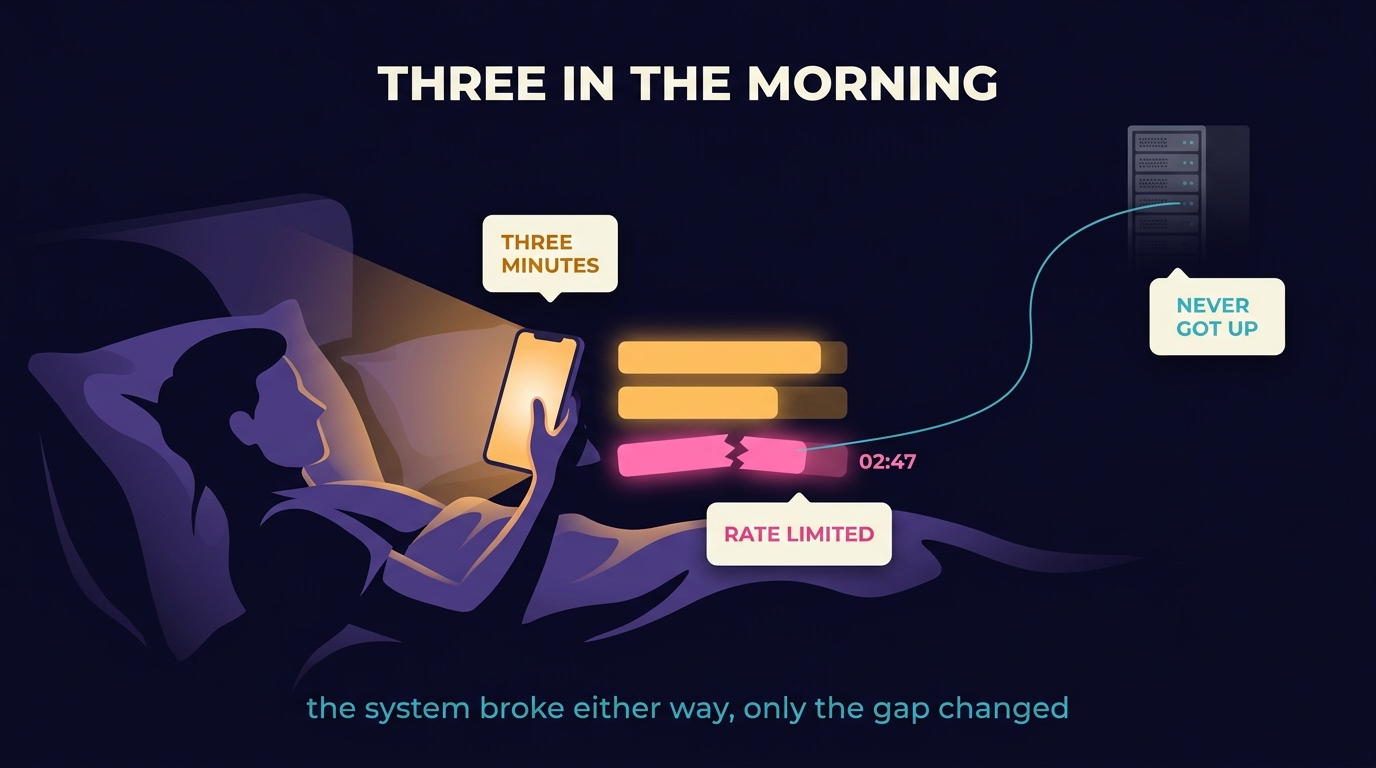
What this actually asks of you
Nothing in this entry requires a platform team, a budget line or a migration. It asks for a handful of habits applied consistently, and consistency is the only part that is hard.
| START HERE | BECAUSE |
|---|---|
| One span at every entry point, one at every external call | this is most of the value and it is a day of work |
| Route templates as span names, identifiers as attributes | gets the cardinality decision right before it costs you |
| One correlation identifier, honoured across every hop including queues | without it the other work produces local stories that never join |
| The branch that fired and the reason a thing did not happen | turns support tickets into queries |
| A counter and a ceiling for everything you rent | converts a cliff into a schedule |
Every item there is a decision made once and then followed. None of them is technically difficult. All of them are the kind of thing that gets skipped under pressure by a reasonable person with a deadline, which is why the earlier section argues for building them into what done means rather than relying on anybody remembering.
The close
The version of this argument I hear most often is that observability is overhead. It is overhead. Sections above put real numbers on it, in CPU and in money, and those numbers aren't small.
The claim isn't that it's free. The claim is that the alternative is merely unpriced. Ignorance doesn't appear on an invoice. It appears as hours nobody logged against it, as slow degradation nobody attributed, as incidents that lasted three hours instead of thirty minutes, and as decisions made from guesses that turned out to be wrong in ways nobody could see at the time. Those costs are real, they are larger than the telemetry bill in most systems I have looked at, and their defining property is that they're invisible.
What I want from a system I run is narrower than a philosophy. I want it to tell me when it's sick before it dies. I want it to explain its failures rather than merely announce them. And I want to be able to ask it something I didn't think to ask when I built it, and get an answer, about a minute that has already passed.
That's available. It costs a few percent of CPU, a manageable share of an infrastructure budget, and the discipline to write things down at the moment they are cheap to write down. A system that can prove what it did is worth more than a system that merely did it, because the first one can be improved and the second one can only be replaced.