
Most support operations grow by accident. Tickets pile up, ad-hoc fixes get bolted on, and frontline staff become punching bags for problems they didn't create and can't solve. Leadership reads the CSAT (customer satisfaction) score, declares the team needs more empathy training, and the cycle repeats. The problem was always the structure, not the empathy. Empathetic operators inside a broken structure produce burnt-out empathetic operators. The structure has to change first.
This essay is a practitioner playbook for changing that structure. It corresponds to People · Product · Process Stage 9 (recalibration cadence and post-sale fulfillment) and to State Machine Everything as the formal lens that turns ticket flow into a bounded state diagram instead of an inbox of dread. The help desk can become an engine of retention and referrals instead of a cost center the company quietly resents.
Cost center or retention engine
Support sits on a binary classification line and both sides are visible from the P&L. On one side it's a cost center: a team that consumes payroll, deflects criticism, and produces a CSAT number leadership argues about. On the other side it's a retention engine: every interaction a small trust deposit, every resolved ticket a documented case that prevents a future ticket, every escalation a signal back to product about what real users struggle with. The same team can occupy either side, and what decides it is how the operation is engineered.
From the source, Andy's framing of the binary: service teams can either be a cost center or an engine of retention and referrals. Most support operations grow by accident. Tickets pile up, ad-hoc fixes get bolted on, and frontline staff become punching bags for problems they didn't create and can't solve. Accidental growth is the trap. A support function that's allowed to grow without a deliberate operating model accrues mass without accruing leverage, and the mass becomes the problem. Adding headcount inside a broken model adds payroll without adding capacity, because the broken model produces interruption rates that scale with team size.
Three operational choices decide which side of the binary the team lands on: how tickets get triaged, how response time gets engineered, and whether resolved tickets feed the knowledge base or evaporate.
Ticket triage · the cheapest leverage in the operation
Triage is the moment a ticket enters the system and gets routed to the correct response tier. Done well it takes under thirty seconds per ticket and produces accurate routing eighty-five percent of the time. Done poorly it takes the same thirty seconds and produces routing accuracy in the fifty-percent range, which means half the tickets get worked by the wrong tier, which means tier-one operators spend hours on issues only engineering can resolve while tier-two engineers get pulled away from product work to answer password resets.
Three triage categories cover most support operations. The first category is instant self-serve: the question is documented, the answer is in the knowledge base, the response is a one-line link. The second category is tier-one resolve: the question requires a human response but follows a known playbook, and an operator with two weeks of training can close it inside the service-level agreement (SLA). The third category is tier-two escalate: the question crosses into engineering territory, requires access the tier-one operator doesn't have, or affects a customer at a tier where senior judgment is required. Some operations split tier-two into engineering versus account-management escalation, and the principle still holds.
The triage rules belong in the system, not the operator's head. From the source: deliverables typically include ticket analysis, improved workflows and SOPs, knowledge bases, macros, escalation paths, and simple metrics so you can see resolution time, backlog health, and where friction actually lives. The escalation paths are the formal version of the triage decision tree. They should be documented as a one-page flowchart that a new hire can follow on day three. Tags fire on common patterns. Macros pre-fill the response. Routing rules send the ticket to the correct queue. The operator is making a triage decision, not constructing one from scratch each time.
The leverage compounds. A triage operation that lands ninety-percent accurate routing reduces the load on tier-two by an order of magnitude compared to one that lands fifty-percent. Tier-two engineers stop being interrupted. Tier-one operators stop being thrown into situations they can't resolve. Customers get a faster response because the response originates at the right tier. The CSAT number that leadership argues about moves on its own, not because anyone trained for empathy.
Response-time engineering · the metric that drives perception
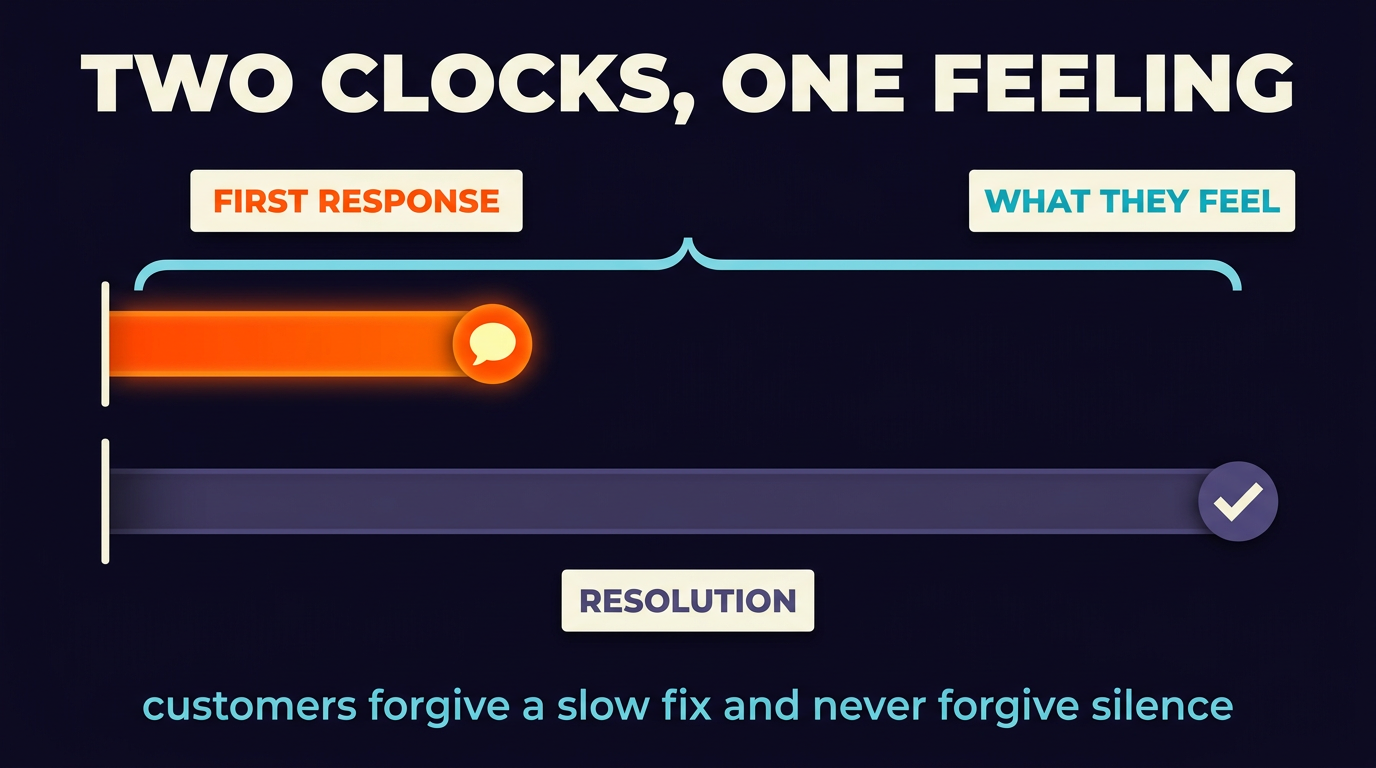
Customers don't measure support quality by resolution time alone; they measure it by the gap between when they sent the ticket and when a real human acknowledged them. The acknowledgment can be a question, a triage update, or a confirmation that the ticket has been seen and routed. What it can't be is silence. A ticket that sits silent for six hours then gets resolved in twenty minutes feels worse than a ticket acknowledged within two minutes and resolved over twenty-four hours. The first feels like neglect. The second feels like attention.
Response-time engineering is the operational design that prioritizes the acknowledgment SLA above the resolution SLA. The system has two clocks. The first-response clock starts when the ticket enters the queue and stops when a human posts a substantive reply. The resolution clock starts at the same moment and stops when the ticket closes. The first clock has the tighter SLA. Tier-one operations should target first response under fifteen minutes during business hours, under sixty minutes off-hours. Resolution targets are tier-dependent and are negotiable; first-response targets are not.
The SLA structure has to be enforced by the system, not the operator's discipline. Timer alerts fire when a ticket approaches breach. Out-of-hours coverage routes through an on-call rotation with paging. Backlog reports surface tickets aging past defined thresholds. The metrics surface in a dashboard the manager checks daily, not a quarterly report nobody reads. The combination of automated escalation plus visible metrics produces the response-time discipline the team would otherwise have to enforce by exhaustion.
Teams that prioritize first-response over resolution tend to resolve faster on the median, because acknowledged tickets receive more accurate context up front (the operator asks the right clarifying question early), which compresses the back-and-forth that drags resolution times. Optimizing for one metric improves the other. The reverse pattern (optimizing only for resolution time) doesn't work; it produces operators who batch tickets, delay first-response, and then race through resolution. Customers feel both the silence and the rush.
The knowledge base · the deflection asset that compounds
Andy's framing on this is the load-bearing one. From the source: every repeated "how do I…?" support ticket is a documentation failure. The framing reads as obvious until you map it against an actual ticket queue. Most support teams answer the same five questions per week, every week, indefinitely. The team's CSAT scores look fine because the answers are correct and the operators are pleasant. The cost is invisible: the team is permanently constrained to handle a class of inbound that should have been retired the first time it was answered well.
The knowledge base is the asset that retires those classes of inbound. Each well-resolved ticket becomes a candidate for a knowledge-base entry, and each entry covers the question, the answer, the troubleshooting steps, the edge cases, and the screenshots. It's linked from inside the support tool so future operators can drop the link as part of the response, and it's indexed in the customer-facing self-serve so the customer can find it before they file the ticket. Each entry, written once, retires that class of inbound permanently or compresses the response from a fifteen-minute exchange to a thirty-second link.
From the same source on knowledge base management: knowledge base management turns that fragile, tribal knowledge into a durable asset that trains new hires, supports existing staff, and powers AI systems. The third clause is the one that scales. A clean KB is the substrate the AI assistant retrieves from. The same documents that deflect human-filed tickets train the bot that answers questions before they reach the queue. The retrieval-augmented generation literature applies here directly: garbage in, garbage out, and careful curation produces an assistant the team trusts and the customer benefits from.
The KB compounds when it has an explicit production process. Resolved tickets get tagged for KB candidacy. A weekly review converts the strongest candidates into entries. Existing entries get audited quarterly for accuracy as the product evolves. Entries that no longer apply get retired or rewritten. The maintenance is the work; without it the KB rots faster than it grows. From the source: I design documentation as an operational system using People-Product-Process. Deliverables typically include a documentation audit, improved information architecture, rewritten or net-new guides, templates, and a simple maintenance process so content doesn't rot. Most teams skip the maintenance process, and it decides whether the asset compounds.
The four metrics that actually matter
Most support dashboards measure dozens of metrics, and most of those metrics are vanity. Four of them carry the weight.
The first is first-response time, the acknowledgment clock from earlier, tracked on the median and the ninetieth percentile. The ninetieth percentile is what customers in the long tail experience. The median is what the manager defends in the quarterly business review. The gap between them tells you whether the operation is consistent or whether a long tail is silently eating retention.
The second is resolution time, the resolution clock, with the same statistical treatment for the same reason. On its own, resolution time is a capacity metric, not a quality metric. Combined with first-response time it tells you whether the operation is fast across the board or only fast on the easy tickets.
The third is deflection rate: the percentage of inbound that gets resolved through the self-serve KB without a human ticket. It's the leading indicator of whether the operation is compounding. A deflection rate trending up over quarters means the KB is working and the team's capacity is being protected. A rate trending flat or down means KB maintenance has fallen behind product changes and the asset is rotting.
The fourth is ticket-to-KB conversion rate: the percentage of resolved tickets that become or update a KB entry. It's the operational health metric for the KB itself. A team with a healthy ticket-to-KB pipeline pays down operational debt every week, and a team where the rate is near zero accumulates debt every week, regardless of how good the resolutions look.
The four metrics together describe the operation accurately. First-response and resolution times describe the present. Deflection rate and ticket-to-KB conversion describe the trajectory. A leadership team that watches all four can tell whether the support operation is moving toward a retention engine or away from one. A team watching only CSAT is reading a lagging number and missing the operational story.
Where to start
There are three starting points, in order of difficulty and impact.
Easiest, do today. Pull the last ninety days of resolved tickets and rank them by frequency of the underlying question. The top five questions almost always represent fifty to seventy percent of total volume. That ranked list is your KB priority queue, with no further analysis required.
Medium, this week. Write the top three knowledge-base entries from that ranked list. Each entry has a clear question header, a one-paragraph answer, screenshots where applicable, and edge-case notes. Publish them to your help center. Drop the links into your support-tool macros so operators can deploy them in one click. Watch the deflection rate move over the next two weeks.
Hardest, this month. Implement a real first-response SLA with system-level enforcement, not policy-level aspiration. Configure the SLA timer in your support tool. Set the alert thresholds. Add an after-hours on-call rotation if you operate across time zones. Publish the SLA externally to customers so they know what to expect. The first month after implementation will surface every weak spot in the operation. The next quarter will show the operation reorganized around a metric that drives perceived quality.
Support operations sit on a binary line, and three operational choices decide which side: triage that routes accurately, response time engineered with a tighter first-response clock than resolution clock, and a knowledge base that eats the repeat ticket classes and compounds capacity over quarters. For the deeper KB practice see the Customer Service and Tech Support article in this cluster; for the workflow lens see Workflow Design.