
Most workflow diagrams are wishful thinking drawn in Lucidchart. They show how the work was supposed to move when the consultant who drew them was being paid to draw them. Six months later, the actual work has rerouted around the diagram. Reps invented their own handoff. Customer success picked up tickets the support team should have escalated. The new hire learned the real process by getting yelled at three times in their first week. The diagram on the wall is a ghost of an org that no longer exists.
Designing workflows that survive that erosion maps onto People · Product · Process Stages 7 through 9, where the implicit operational machinery becomes explicit, gets bottleneck-audited, and gets recalibrated as the company changes. This guide builds on State Machine Everything, the formal lens that says every workflow has named states and named transitions whether you draw them or not. The work here is making the drawing match the territory and keeping it that way.
Why most workflow diagrams die in week three
Workflow diagrams die for the same three reasons regardless of industry. They optimize for visual elegance instead of operational truth. They hide the failure paths because failure paths are ugly. And they have no enforcement layer, so the moment work disagrees with the diagram, the work wins and the diagram becomes wallpaper.
Visual elegance is the first killer. A clean diagram with seven boxes and six arrows looks like a system. A real workflow has seventeen boxes, twenty-three arrows, six failure modes, and four edge cases that fire often enough to matter. The clean diagram is a marketing artifact: it looks good in the deck and doesn't match the work. The clean version is the one that gets approved and the real version never gets drawn. The team runs the real version every day while the company believes it runs the clean one. The gap between belief and operation is where deals leak.
The second killer is hiding the failure paths. Most diagrams show the happy path: lead arrives, gets qualified, gets routed, gets sold to, becomes customer. The unhappy path is what consumes the operational time. The lead arrives missing a field, gets stuck in a no-owner queue, gets routed back to marketing for re-enrichment, gets re-qualified by a different rep who disagrees with the first rep's read, and finally gets either closed or dropped. That path is six steps and four owners, and it happens to fifteen percent of inbound. The diagram leaves it out because it's ugly. The team handles it ad hoc, each handler invents a slightly different procedure, and the variance compounds.
The third killer is the missing enforcement layer. The diagram lives in a Notion page nobody opens, the workflow rules don't gate stage transitions, and the system doesn't enforce handoffs. A rep can move a deal from SDR to AE by changing a dropdown without the SDR's confirmation, the AE's acknowledgment, or any data validation. The workflow becomes a suggestion, and suggestions get followed when they're convenient and abandoned when they aren't.
Three design principles that change everything
Three principles decide whether a workflow design survives or ends up decorating a Notion page.
Measure every handoff. A handoff is a place where work changes ownership. Each handoff has a sender, a receiver, an artifact that gets passed, and an acknowledgment that closes the loop. Every one of those four elements is a measurement point. How long did the artifact wait between sender and receiver? Did the acknowledgment fire? What percentage of handoffs at this junction get sent back for missing information? Those measurements are the only way to detect that the workflow has started to drift before the drift becomes a quarter-shaped hole in revenue.
Enforce every gate. A gate is a stage transition that shouldn't happen unless specific conditions are met, and the conditions are operational, not aspirational. A discovery call can't move to proposal until the BANCE qualification checklist has been logged. A lead can't move to MQL until the firmographic filter has matched. A customer can't move to a renewal conversation until product usage hits a defined threshold. A gate that exists only in a policy document doesn't count as a gate. The difference is whether the system rejects the transition or logs it and waits for a human to notice it shouldn't have happened.
Show every failure path. The diagram has to include the unhappy paths or it doesn't describe the work. The lead missing a field, the deal that goes silent for thirty days and the customer who churns mid-cycle each have a path, and each of those paths has an owner, an SLA and a playbook for resolution. A diagram with the failure paths drawn in is uglier than one with only the happy path, and the ugly one is the one that runs the company.
Andy's framing on this from the source: typical deliverables include workflow maps, implemented automations in tools like Make, n8n, and Zapier, plus alerting, logging, and simple runbooks so you're not dependent on me long-term. What gets delivered is the maps together with the automations, the alerting and the runbooks, and a map without the rest is decorative.
The swim-lane discipline · ownership before automation
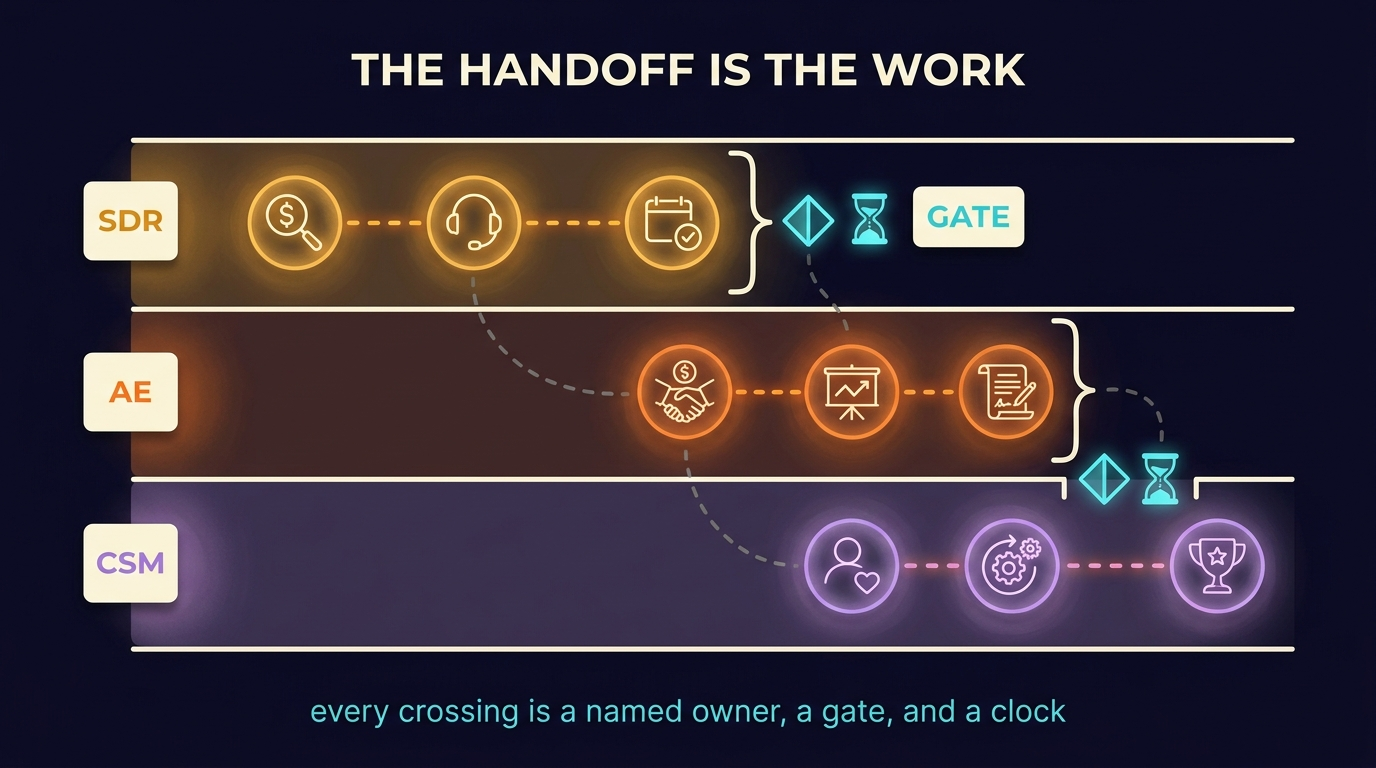
Swim lanes are the cheapest forcing function in workflow design. Every box belongs to exactly one lane, and each lane is named after the role that owns the work: Sales Development, Account Executive, Customer Success Manager, Support Tier One, Support Tier Two, Engineering On-Call. A lane is a column or a row depending on the diagram's orientation, and the work flows through the lanes left to right or top to bottom. A transition that crosses a lane boundary is a handoff, and one that stays within a lane is an internal step.
The discipline forces ownership before automation. You can't draw a swim-lane diagram without naming who owns each box, and a diagram that doesn't name owners gets rejected. Assigning every box to a lane surfaces the boxes nobody owns. Those orphan boxes are where the work currently goes to die, and they're also where the team knows the system is broken but can't say why. Naming the owner names the breakage.
Once owners exist, the handoffs across lanes become the highest-leverage instrumentation targets. A handoff that crosses two lanes has two failure modes the lanes themselves don't have: the sender forgot to send, and the receiver forgot to acknowledge. Both failure modes are silent unless the system instruments them. The instrumentation is mechanical: an SLA timer on the handoff event, an alert when the timer breaches, a periodic backlog report on outstanding handoffs.
The Operational Systems portfolio framing makes this concrete. From the source: this category builds the systems that sit after the sale: how leads get worked, how customers are onboarded and supported, how knowledge is packaged, and how communities and programs run week after week without burning people out. All of those are swim-lane workflows, and the same discipline applies to the inbound funnel, the post-sale onboarding, the customer-success playbook and the support escalation tree. The lanes change from one workflow to the next, and the discipline stays the same.
Automation comes last, not first
Reaching for automation first is the most expensive instinct in workflow design. Make, n8n and Zapier make it trivial to wire any two systems together, and that ease is the trap. Automating a broken process gives you a broken process running at scale: the errors compound faster, the reps lose the ability to interrupt mid-flow because the system now fires without them, and the cleanup is harder than the original problem.
The correct sequence is the one Andy uses on every operational engagement. From the source: I start with People: how your team actually operates, where attention leaks, and which mistakes keep repeating. Then we map Product (the services you deliver) and Process (the steps that turn a lead, order, or ticket into revenue). Only then do we decide what to automate versus what to leave manual. The 10,000 sq ft metal-shop work applied that sequence to the order-to-fulfillment flow before adding production boards, priority rules, and feedback loops. The People-Product-Process diagnosis comes first, the map second and the instrumentation third. The automation comes last, and only on the steps that passed all three earlier filters.
The boundary between what to automate and what to leave manual follows three operational tests. Does the step happen often enough to amortize the build cost? Is the step deterministic enough that the rules can capture all the cases the team currently handles? Does breaking the automation produce a recoverable state, or does it cascade silent corruption downstream? A step that fires daily, follows a clear ruleset, and breaks loudly when it fails is a strong automation candidate. A step that fires twice a quarter, has fuzzy edge cases, and fails silently is not. The team's intuition about which steps are which is usually wrong in both directions, which is why the test matrix has to be explicit.
Andy's eight-figure agency engagement is the canonical example. The round-robin task assignment for media buyers was one tightly scoped automation that handled high-frequency deterministic work and failed loud when something went wrong. Everything else stayed manual. The one part that should have been automated was, the rest of the workflow had room for human judgment, and the agency stayed an agency instead of turning into an automation theme park.
Runbooks · the playbook that survives the operator
Every workflow has failure modes that fire often enough to be predictable: the lead that arrives without a phone number, the deal that goes silent at proposal, the customer who churns at month four, the support ticket that bounces between two teams because neither owns it. Each of these has a recognizable shape. The team currently handles each one through the most experienced operator's improvisation, and that improvisation is the bottleneck. When the experienced operator leaves or goes on vacation, the failure mode goes from a fifteen-minute resolution to a three-day fire drill.
A runbook externalizes that improvisation into a durable artifact, one page per recurring failure mode, and the page has four sections. The trigger is what the operator sees that tells them this runbook applies. The response is the steps they take, in order, with named tools and named owners. The escalation says what happens if the response doesn't work, who gets paged, and what data they need to have ready. The postmortem says what gets logged after the incident, where it gets logged, and who reads it next quarter to decide whether the runbook needs to change.
Documentation describes systems for someone trying to understand them. A runbook describes responses for someone in the middle of the situation, so its voice is imperative where documentation's is reflective: Open the dashboard. Filter to the affected accounts. Page the on-call engineer if the count exceeds twenty. The reader is mid-incident, not researching, so a runbook uses short sentences, active voice and no background.
Runbooks compound. Each one written removes a class of incident from the experienced operator's plate, and the team handles that situation correctly without consulting anyone. The runbook gets refined every time it's used, and a quarterly review consolidates the changes. After a year of disciplined runbook writing, the team has built the institutional memory that used to live in two senior heads. The senior operators are freed from incident response and recover capacity for work with real leverage, and hiring gets faster because the new hire can run the operational machine on day thirty instead of day ninety.
Where to start
There are three places to start, in order of difficulty and impact.
Easiest, do today. Pick one cross-functional handoff your team runs daily, such as inbound lead to SDR, SDR to AE, or AE to onboarding, and time it for a week. Log the actual elapsed minutes from sender action to receiver acknowledgment for every instance, with no exceptions. At the end of the week, look at the distribution. The median is what your dashboard claims, the ninetieth percentile is what your customers experience, and the gap between them is where the work goes to die.
Medium, this week. Pick one workflow and draw the swim-lane version with the failure paths included: the version that shows the fifteen percent of inbound that takes the unhappy path, not the marketing-deck version. Show it to the team and watch where they correct you: the corrections are the workflow. Update the diagram until they stop correcting.
Hardest, this month. Write the first runbook, for the failure mode you currently handle most often, with a trigger paragraph, a response checklist, the escalation criteria and a postmortem template. Run the next incident through the runbook and refine it, then run the incident after that and refine it again. After three iterations the runbook is a durable artifact, and after three months, ten runbooks make the operational machine portable across the team.
Workflows that survive contact with reality measure every handoff, enforce every gate, and show every failure path. The deliverable is the diagram plus the instrumentation, the runbooks and the discipline to retire automations that no longer earn their keep. For the formal treatment of states and transitions see State Machine Everything; for the diagnostic that decides whether a workflow problem is upstream see People · Product · Process.