

One minute of video had two prices
A page of nineteen short films made me ask what one play costs
This month I priced one minute of video on two services. Sending that minute out of the general data platform we already used came to about two thirds of a cent. Streaming it from a service built only for video came to a tenth of a cent. That's about six times the price for the same minute, on list prices I checked on 20 November 2026. Put 5,000 heavy viewers on it and the gap is roughly $1,250 a month against $60. Put a 25-person team on it and the saving is about two dollars a month. I moved the video anyway, the same day, and the reason I'd move it for two dollars says more about running a business than the six-to-one price gap does.
This starts as a cloud bill, which is easy to understand, easy to compute and easy to picture. A few thousand words from now it will be a long way down a rabbit hole, working out how a small company can make any kind of media at the scale of a studio director with decades in the chair. The bill is the right door. Everything further down is the move I made on this bill, made again on stranger things.

The bill started on a review page. We had made nineteen short films for a Construction and Engineering industry client, and the client needed one link where they could watch each film and tell us what to change. I wanted a feedback box under every film that saved each note as a comment, so a second thought on Thursday had somewhere to go. All nineteen films together run ten minutes and thirty-six seconds. The source files add up to 543.1 megabytes. That's the whole library.
Everything else in that build already lived on Convex, which is the general data platform I start most projects on. It holds the records, the comments, the logins and the files, and it does most things reasonably well. So the films went there too, right beside their records. That was the natural place for them, and I'd make the same first choice again.
Then I got nervous. Before a single number came back, I asked for the films to be hosted in a way that wouldn't blow up the bill, because I didn't want every play to pull down a whole video file. I had no evidence for that fear. I'd just been around long enough to know that video is heavy, and that somebody pays every time a heavy thing moves. Video is the heaviest thing the internet carries. Sandvine's 2024 traffic report puts it at 38 percent of everything people download.

The first answer that came back made me swear. For a few minutes I thought we were looking at a difference of a hundred times or more, and I announced that we were never using Convex for video playback again. Then the careful number arrived. It was smaller, and it was still plenty. My fear about whole files turned out to be wrong: Convex bills for the bytes it sends, and a viewer who leaves early is only sent part of the file. What survived the checking was a clean comparison of one fully paid minute on each service. That minute costs about $0.0068 on Convex's Starter rate and about $0.0062 on its Professional rate. It costs $0.001 on Mux at 1080p. That's 6.8 times on one plan and 6.1 on the other.
Six times is a big gap in almost any business. If a supplier offered you the same part at a sixth of the price, you wouldn't call a meeting. I can't stop there, though. A rate is only half of a bill. The other half is how many units you buy, and a small team buys hardly any. I'll put real team sizes on it two chapters from now.
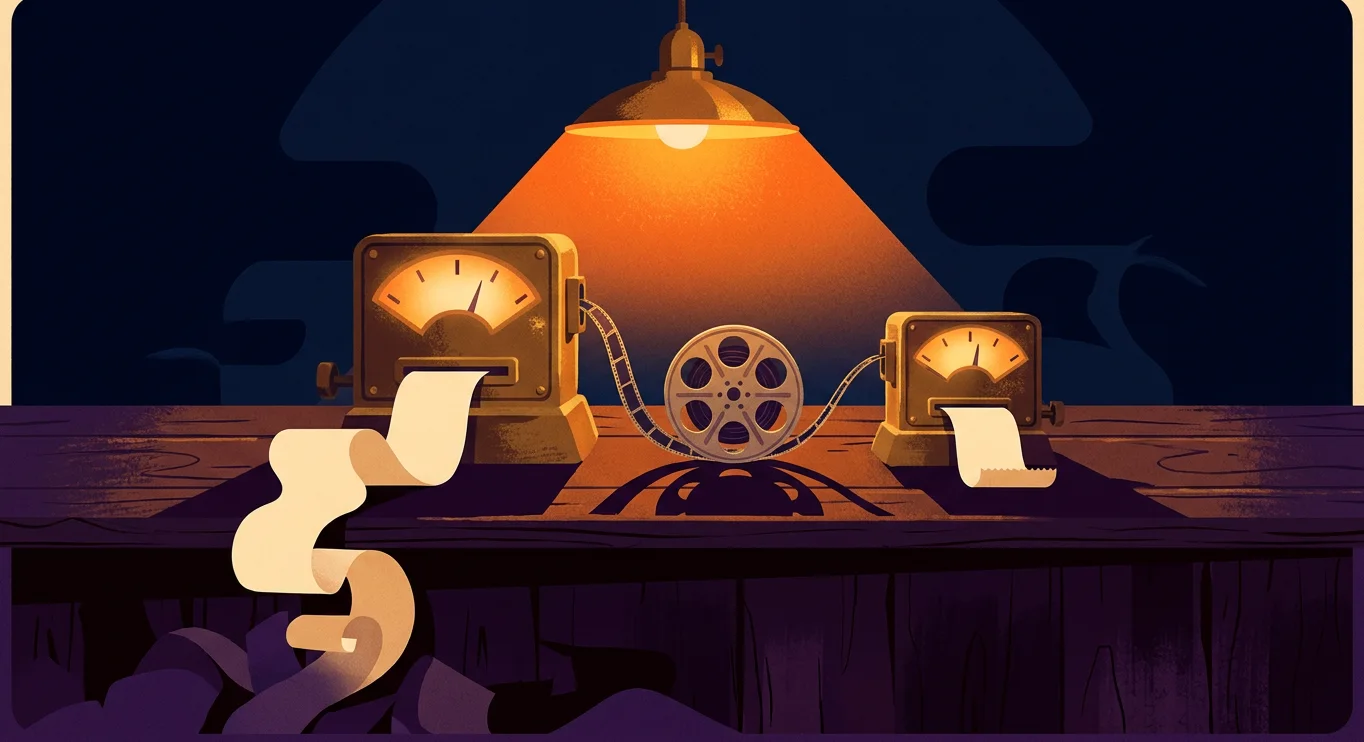
One thing about these numbers before we go on. Nobody read an invoice. I modelled every figure in this part from the two companies' public rate cards and from the measured size and length of our own nineteen files. That's a fair way to compare two prices. It's a different thing from a bill that arrived, so I'll keep telling you which one you're looking at. And it leaves the question I couldn't stop poking at. It was the same film, the same minute and the same viewer. Why did it have two prices?
One service weighs the video and the other one times it
The minute had two prices because the two services measure different things. Convex is a general platform, so it sells the general unit, which is data leaving the building by the gigabyte. Its limits page says the egress charge "includes serving user files". Mux only does video, so it sells video's own unit, which is the minute. Its pricing page says it as plainly as I've seen a vendor say anything: "We price Video in minutes, not file size." One of them puts your film on a scale. The other holds a stopwatch.
You can do this arithmetic on a napkin. Our nineteen source files weigh 543.1 megabytes and run 10.6 minutes, so one minute of our film weighs about 51 megabytes. Convex charges $0.132 for each gigabyte past the first one on its Starter plan, and $0.12 for each gigabyte past the first fifty on Professional. Fifty-one megabytes is about a twentieth of a gigabyte, so that minute costs about two thirds of a cent. Mux charges a tenth of a cent for a delivered minute at 1080p, once the first 100,000 minutes of the month are used up, and those first 100,000 are free. Divide one price by the other and you get 6.8 on Starter and 6.1 on Professional. A heavier file would widen the gap. A lighter file would narrow it.
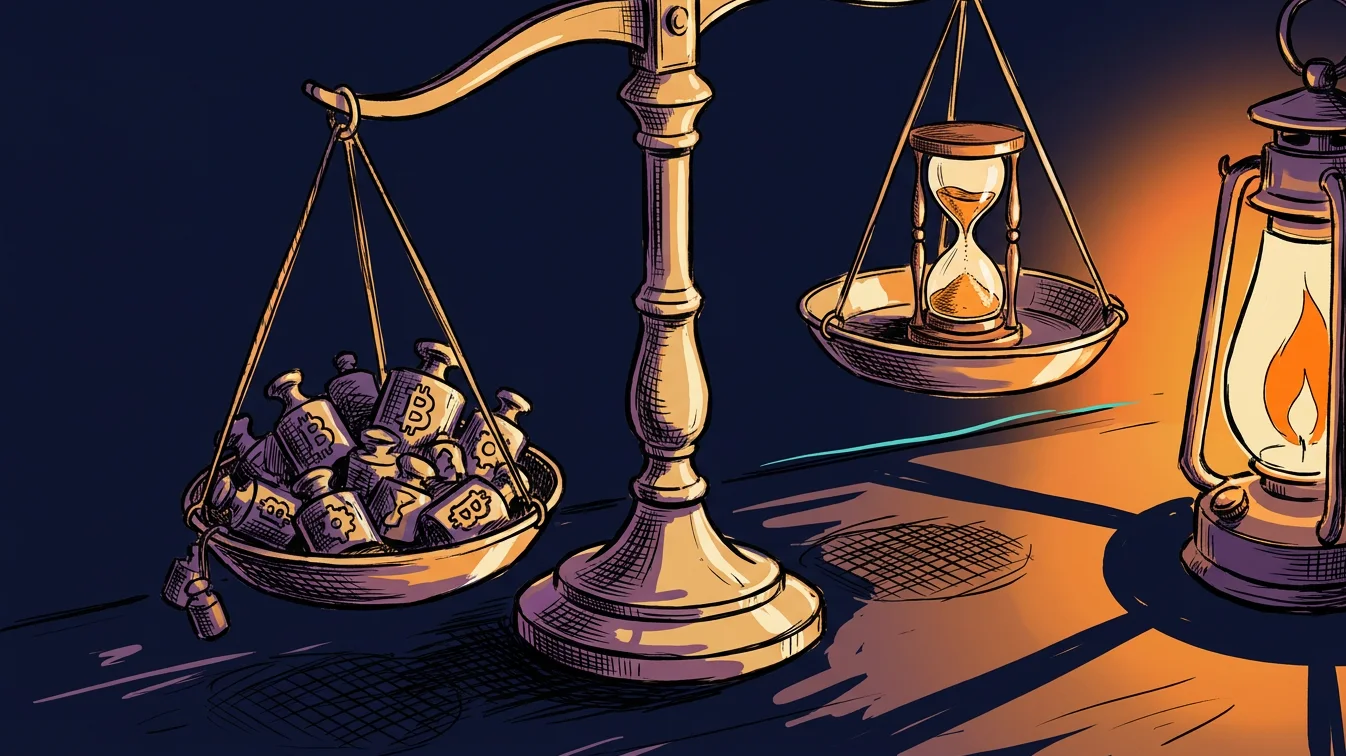
Both meters count what was sent, whether or not anybody watched it. This is the part I had wrong that morning, so I'll correct it properly. Neither service charges for a whole film when someone watches ten seconds and leaves. Both count what crossed the wire. Both also count a little more than what was watched, because a video player fetches a few seconds ahead so the picture doesn't stall. Mux says so in its own docs: if a player buffers 20 seconds ahead, Mux has to deliver those seconds whether anyone watches them or not, "and so those seconds are charged". Nobody is being sneaky on either side. The two bills differ because the units have different prices.
A specialist also sends less. There's a second reason a video service wins, and my model leaves it out, which makes the model kind to Convex. A stored file is one size. Whoever presses play is sent that size, whether they're on office fibre or on a phone at a job site with one bar. A streaming service keeps several versions of each film and hands a weak connection a smaller picture. Mux then bills that minute at the smaller picture's rate.
I priced every Mux minute at the full 1080p rate, so the real gap is probably a little wider than six. I can't tell you how much wider for this library, because nobody measured it.
Somebody else already paid for this lesson at a bigger size. While I was checking my numbers I read an account by an engineer named Kuldeep Pisda, who ran video for a course platform serving phones in India. On an ordinary day about 5,000 people watched his videos, and the delivery bill for that one day was about $1,500. Nothing had broken. Each lesson shipped as a single file of about 1.2 gigabytes, and every phone that pressed play was sent that fat file at about 17 cents a gigabyte. He worked out that cutting the same lessons into smaller streaming versions would have sent roughly a fifth of the bytes and turned that day into about $300. He published the arithmetic, including why he waited. He wrote that "the system worked perfectly, and that was the problem."
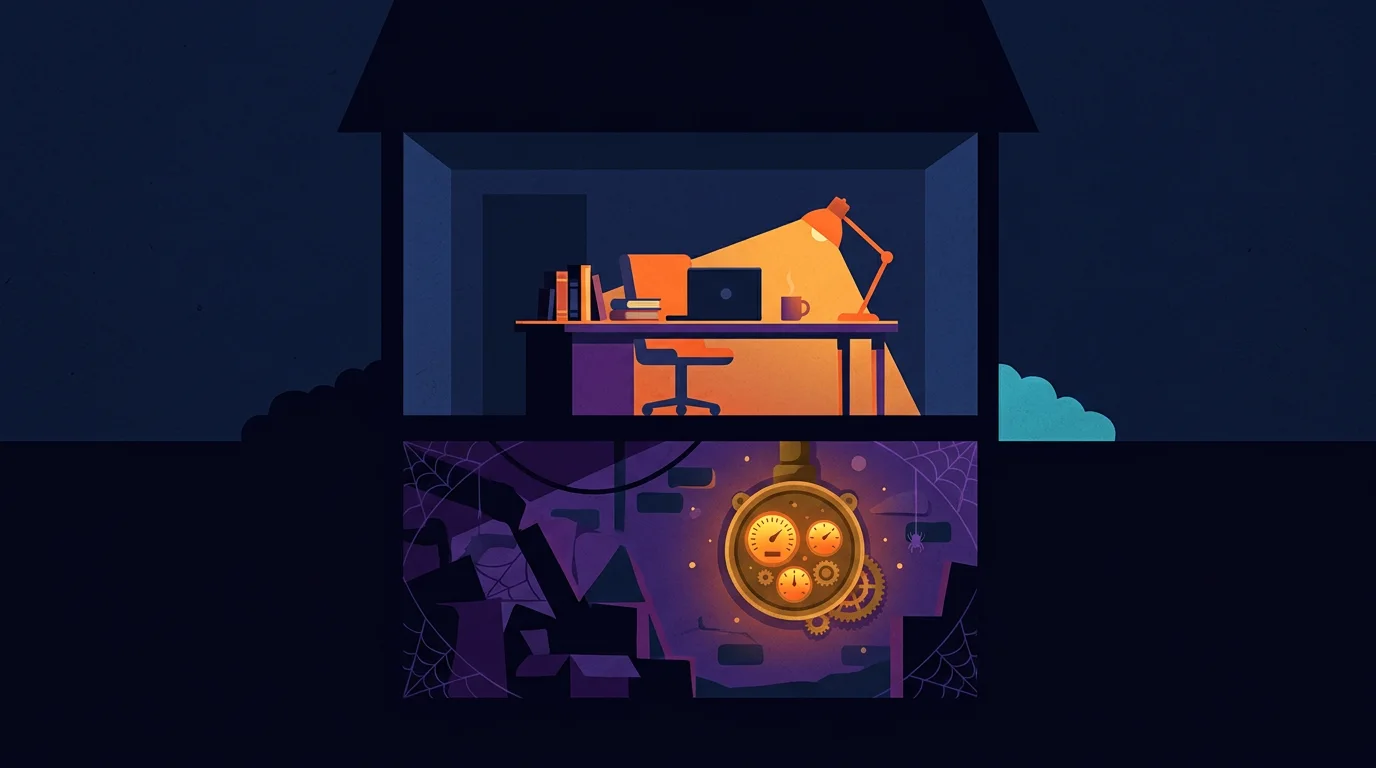
Starting on a general platform was still right. I'm not complaining about Convex. I start broad on purpose, and Part 2 is about why. A general platform that does most things reasonably well gets a project working in days. Its makers are plainly awake at the meter, too. In April 2026 they replaced their old file bandwidth charge with a broader one at $0.12 a gigabyte, which they described as a nearly threefold cut. Before that change my six would have been closer to eighteen, by my own arithmetic. The platform was fine. One job inside it had its own meter running in the cellar, and I happened to go down and look.
So I had a rate. It was six times, per paid minute, modelled. A rate can't tell you what lands on a bill, though. For that you need to know how many people are watching, and how much. What would it have cost a team your size?
A team of 25 saves about two dollars a month
To answer that, I asked for three sizes of company: a small internal team of 10 to 25 people, a mid-sized one of 25 to 250, and a platform of 250 and up. The library stays the same nineteen films every time. Only the audience changes.
I had to guess how people watch, so here are my guesses. A "typical" month in this model means each person starts about one clip per workday, 24 a month, and watches three quarters of it. A "light" month is six starts and half of each clip. A "heavy" month is 60 starts at 90 percent, which is what onboarding week or a round of sign-offs looks like. On top of what's watched, I added a few seconds of buffer per start and a little extra for people dragging the playhead around. The headcount includes the people who never open the page. A real viewing log would beat every one of those guesses, and I don't have one.
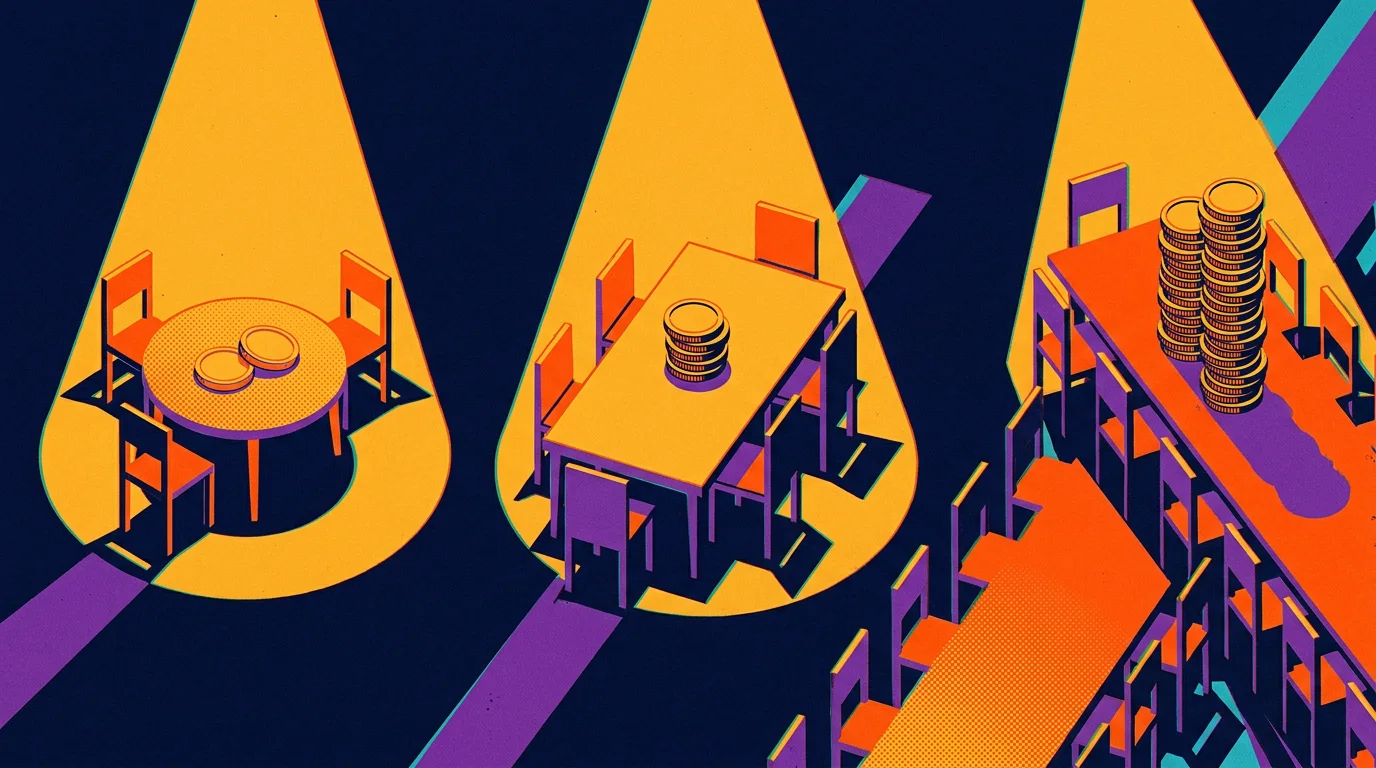
At 10 to 25 people the saving is pocket change. Ten people on a typical month send about 6 gigabytes and cost 71 cents on Convex Starter. Twenty-five people cost $1.98. On Convex Professional, both teams fit inside the 50 gigabytes the plan already includes, so the video adds nothing. On Mux both are free. That's a saving of somewhere between zero and $24 a year. You'd spend more than that on coffee for the meeting where you discussed it.
Here's the whole model in one table, using Convex's Starter rates. The Mux column assumes the account's free minutes and its $20 monthly credit aren't being used up by some other library.
| People | Convex Starter, typical month | Convex Starter, heavy month | Mux, same months |
|---|---|---|---|
| 10 | $0.71 | $2.38 | $0 |
| 25 | $1.98 | $6.14 | $0 |
| 250 | $21.01 | $62.55 | $0 |
| 1,000 | $84.42 | $250.60 | $0 |
| 5,000 | $422.63 | $1,253.54 | $0 typical, $59.40 heavy |
Between 25 and 250 people the saving becomes a number you'd notice. At 250 people a typical month is $21.01 on Starter and $13.22 on Professional. Now look at what a heavy month does to those same 250 people. The Starter figure triples to $62.55, and nobody was hired. All that happened is that the people you already had watched more, finished more and scrubbed around more. That's about $750 a year if every month ran heavy. It's still small. It's also the first row where the bill moves because of something you'd never think to connect with a bill, such as a busy training month.
A video bill becomes a line item past 250 people. At 1,000 people a typical month costs $84.42 on Starter and a heavy one costs $250.60. At 5,000 people the typical month is $422.63, and the heavy month is $1,253.54 against $59.40 on Mux. That last row is a difference of about $14,300 a year for showing the same ten minutes of film.
If you check my division you'll see the heavy row comes out near 21 to 1, which is a lot more than six. The extra comes from Mux's free minutes and its monthly credit, which are still soaking up part of the load at that size. Six is the price of a minute. Twenty-one is what one particular bill looks like.
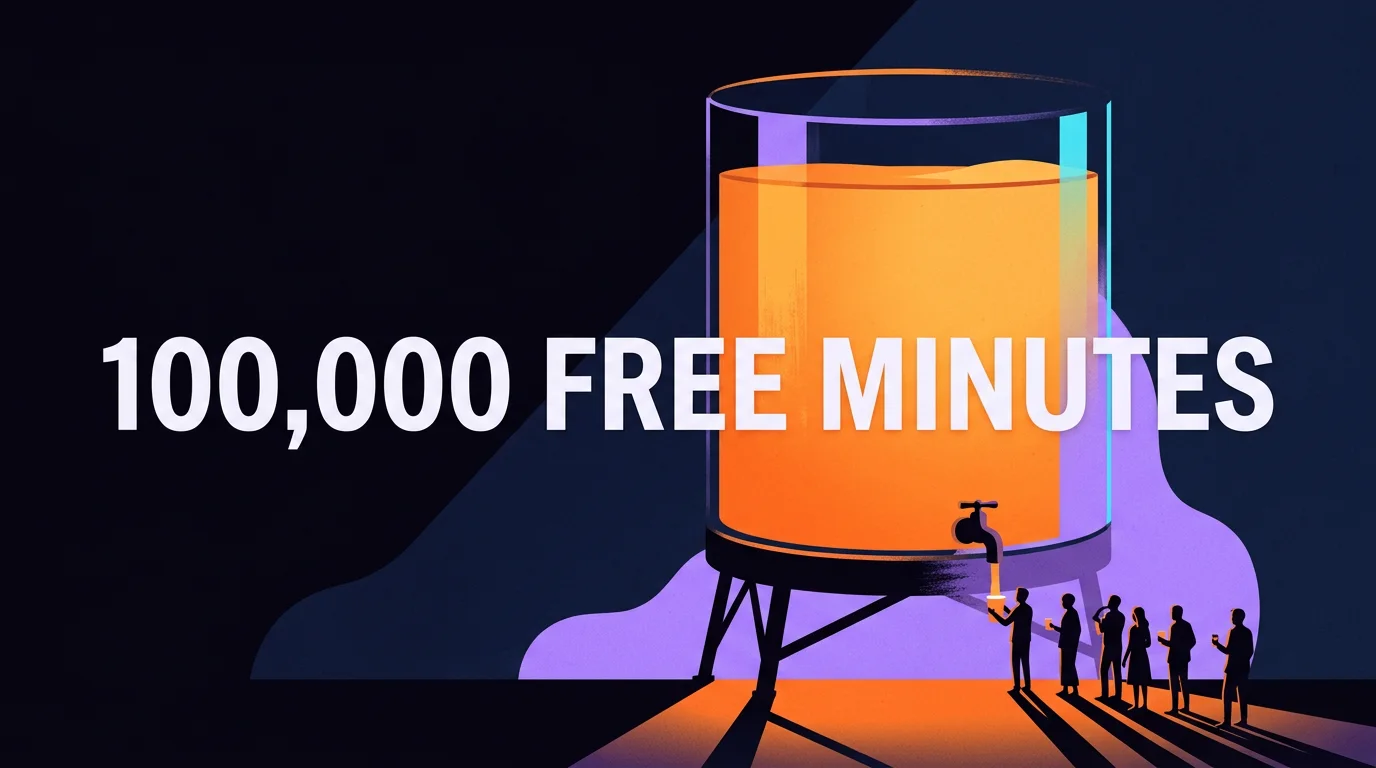
Mux gives away the first 100,000 minutes every month. That is a lot of free video. Our entire library, played start to finish, fits into that allowance 9,433 times. A team of 25 on a typical month uses about 308 of those minutes, a third of one percent. On my guesses the allowance doesn't run out until about 8,100 people on typical use, or about 2,800 on heavy use. That's why the Mux column in the table is a wall of zeros.
A few limits on all of this, so you can weigh it properly. Above Professional, Convex sells Business and Enterprise plans on negotiated terms, and I can't price a contract I haven't seen. If your Convex plan's included gigabytes are already used up by the rest of your app, the Professional column gets a few dollars worse. If your Mux account is already serving another library, its zeros start later. And I left the cost of the move itself off both sides, because that depends on your player and your developer.
So for most companies reading this, the dollars say don't bother. Two dollars a month doesn't pay for the hour it takes to change a video player. I changed it anyway. Why would anyone do that?
My mentor called hidden costs snakes in the grass
I changed it because of where that link was going next. A review page for one client is a quiet thing. A link is also the easiest object in any company to forward. If the films are good, the sensible next move is to send them to a crew, then to every new hire, then to a public page. Behind those nineteen films sat a far larger archive of footage waiting for the same treatment. Nothing about the page changes on the day the audience grows. It's the same link and the same play button. What changes is a meter that almost nobody at the company knows exists, and it's running at six times the rate it needed to.
My mentor had a name for a cost you can't see yet. He called them snakes in the grass. Before you go running off into the field, it may look pretty, and those flowers may be beautiful, but you may want to get at least an estimate of how many snakes there are in the grass before you start rolling around in it.
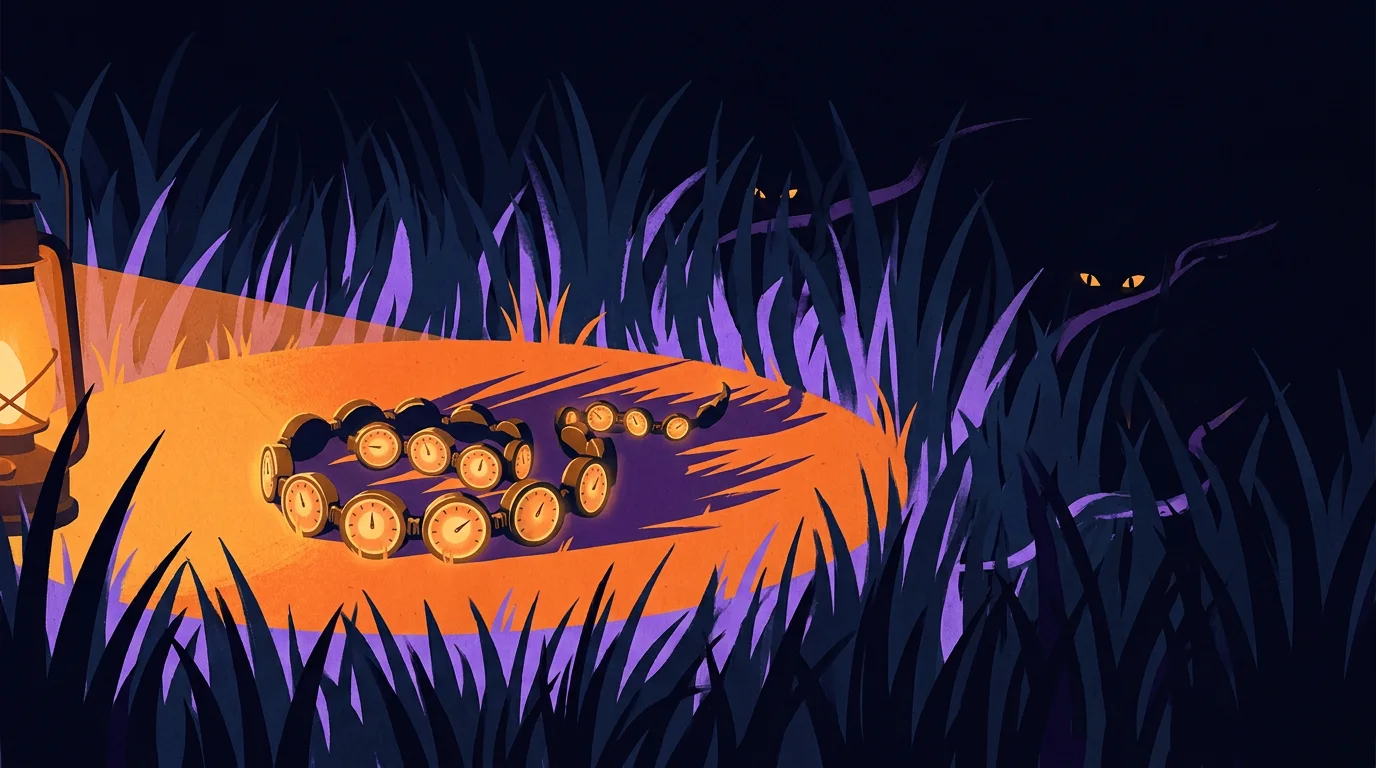
I went looking for where the saying comes from, and it's older than I expected. It's also stranger, because the original has flowers in it too. About two thousand years ago Virgil had a shepherd call out a warning in his third Eclogue: you boys picking flowers and strawberries off the ground, get out of there, a cold snake is hiding in the grass. In Latin it ends "latet anguis in herba". My mentor handed me the same warning with the same props, twenty centuries later.
A more popular saying tells you not to look. It goes: what you don't know can't hurt you. Whoever coined it deserves a stick with a lot of knobs on it. What you don't know absolutely can hurt you, and anyone who has swum out past the sight of land knows it.
The line has a known author. The Oxford Dictionary of Proverbs traces the line to George Pettie in 1576, and the University of Michigan keeps the original page online. The speaker is a wife who suspects her husband is cheating and is talking herself out of checking. "Why should I seeke to take him in it?" she asks. "So long as I know it not, it hurteth mee not." So the saying started as one frightened person's reason for leaving a door closed. Somewhere in the next 450 years it got promoted to a business philosophy.
One developer found the snake by opening an email. In February 2024 a developer who ran a small Cantonese language site on a free hosting plan got an email saying they owed $104,500. The site had about 200 visitors a day and had never used more than 10 gigabytes in a month. Then something downloaded one 3.44 megabyte sound file millions of times. That came to 190 terabytes in four days, billed at $55 per 100 gigabytes. Support offered to cut the bill to about $5,000. The developer posted the story, it spread, and the host's chief executive wrote that they wouldn't be charged, adding that the company had "forgiven lots and lots of bills over the last 9 years". Credit to Netlify for that, and for saying they'd change the default so free sites can't run up overages. It's still a rough way to learn you had a meter.
Both of my vendors give an owner something to hold here, and it's worth asking your builder which one you have. Convex lets a team set a spending limit with two levels: a warning that sends an email, and a hard stop that switches the team's projects off. Mux added spending alerts in October 2026, and its docs say plainly that the alerts "don't cap or pause anything". One is a brake and the other is a smoke detector, and you should know which is installed.
One server out of eight cost a trading firm $460 million. That one is a bandwidth story, a close cousin of mine. The purest snake story I know comes from trading. On 1 August 2012 a firm called Knight Capital switched on new code for routing stock orders. A technician had copied it to seven of the firm's eight servers, and nobody checked the eighth. The new code reused a switch that, on the old code, woke up a function the firm had stopped using in 2003. When the market opened, the eighth server took 212 ordinary customer orders and fired millions of orders after them. It ran for about 45 minutes. The Securities and Exchange Commission's order puts the loss at more than $460 million. Five days later a group of investors put in $400 million to keep the firm open, and within a year it had merged into a rival.
One detail from the SEC's own summary has stayed with me. Before the market opened that morning, an internal system at Knight sent 97 automated emails that pointed at the problem. They weren't designed as alarms, so nobody treated them as alarms. The snake was sitting in the inbox. My two dollars and their $460 million have nothing in common as amounts. They have the same shape, which is a system that worked everywhere somebody looked and failed in the one place nobody did.
That leaves a practical problem. You can't look everywhere. A field is big and an afternoon is short, and every hour spent hunting for snakes is an hour not spent building. So who knows where to point the lantern?
A senior operator has already met most of the snakes
The person who knows is somebody who has already been bitten there. It sounds obvious written down. One of the most common misconceptions I meet among business owners still runs the other way, which is that they can hire just any agency operator. Any web builder will do, they think, and any ad buyer will get the same results. I understand why that's tempting. From the buyer's chair, two quotes for a website look like the same website at two prices.
Economists have a name for work you can't judge even after you've paid for it. In 1973 Michael Darby and Edi Karni called these credence goods, and the standard examples are doctors, mechanics and lawyers. The seller diagnoses what you need and then sells it to you, and you often can't tell afterwards whether you got the right thing. Software built by an agency belongs on that list. Agent engineering belongs on that list too, so ask any builder for a track record. The track record is the one part of the purchase you can inspect.

I sort what a person knows into education, expertise and experience. It's a pretty core way of looking at things for me, and this bill shows all three at work. Education is being able to read the two rate cards. They're public, and I've linked them above. Expertise is setting up the comparison so it's fair, with the same film and the same minute, and knowing that a rate and a bill are different things. Experience is sensing the cost before anyone has run the numbers, because you've been billed for that mistake before. Hire someone who has done what you're trying to do, or who has a great deal of education or experience in it.
A junior misses a hidden meter because he's never been billed by one. For a person to develop skill, to go from knowing nothing to knowing something, they have to do the thing. A senior builder knows that video served from a general database runs up a bill, and a junior doesn't, only because he hasn't been billed for it yet. A junior may not know that, and the only reason is that he hasn't done it before. Fire departments say the same about their own people. Jeff Johnson wrote in Fire Engineering that junior firefighters arrive with the same basic training the seniors received. What they don't have yet is the fires.
A fire lieutenant ordered his crew out of a house that looked safe. I was poking through Gary Klein's Sources of Power, a book about how people decide under pressure, and it tells a story about a lieutenant at a house fire. The fire was at the back of a one-story house, in the kitchen. His crew sprayed it and it roared straight back. They tried again and got the same result. He started to feel that something was off, without being able to say what, and he ordered everyone out. The floor they'd been standing on collapsed moments later. The real fire was in a basement he didn't know the house had. When Klein asked how he knew, the lieutenant said he thought it was a sixth sense. With careful questions Klein got to what he had noticed. The room was hotter than a kitchen fire should make it, and it was far too quiet for that much heat.
Klein and his colleagues interviewed 26 fireground commanders with an average of 23 years on the job, and in more than 80 percent of the decisions they studied the commander recognized the situation and acted without weighing options. Anyone who hires for a living should read his book.
One caution, so I don't oversell grey hair. The late Anders Ericsson, who spent his career studying how people get good at things, found that in many professions years on the job have only a weak relationship with measured performance. What builds skill is doing the work with feedback, where you find out each time whether you were right. That finding tells you what to ask a builder. Don't ask how long they've been doing it. Ask what went wrong for them and what they check now because of it.
A cheap pipe carrying heavy files is a quiet room of the same kind. Nothing is wrong yet, and the bill is already on its way.
A senior operator's job stays the same whatever you're optimizing for. Whether you're after performance, lower costs, revenue or profit, a senior operator's job is to know which meters serve that goal and which run against it. The second kind isn't rare. In Flexera's 2026 survey of more than 750 cloud decision-makers, respondents estimated that 29 percent of their cloud spend was wasted. Those are self-estimates collected by a company that sells cost tools, so hold the figure loosely. Regulators have noticed the same kind of meter. Britain's communications regulator, Ofcom, reported in 2023 that charges for moving data out of a cloud "can create significant additional cost and uncertainty for customers". Much later I'll come back to the other side of that coin, which is turning a few thousand dollars of AI subscriptions into work worth a lot more than they cost.

A person who knows the field also wants more tools than the job needs, and I'm that person. On the same project where I moved the video to a specialist, I left a different specialist on the shelf. It's a vector store called Qdrant. I want it. So what had video earned that Qdrant hadn't?
I move one job off a general platform only when the numbers tell me to

I start every build on one general platform
A 6x gap on one line of a bill made me want to go shopping. One specialist had just beaten my general platform at video, so my next thought was that a specialist must be waiting for every other job too. I talked myself out of it, and this part is how.
I start broad with a platform that does most things reasonably well. For me that platform is Convex. It keeps the records, saves the comments, checks who's allowed to see a page, runs the small background jobs and holds the small files. None of those is the best version of that job on the market. Every one of them is good enough to put a working page in front of a real person this week. I need that page, because on day one I don't know what the work is going to be. I have opinions. I don't have evidence.
Think of a general store in a small town. One shopkeeper sells you nails, flour, a stamp and a pair of boots. A big city has a better shop for each of those. The town still needs the general store first, because nobody knows yet which of those four things the town will buy by the truckload.
Engineers still quote a children's doctor on starting simple. John Gall was a pediatrician who wrote a strange, funny little book in 1975 called Systemantics. One line from it gets passed around engineering teams as Gall's law: "A complex system that works is invariably found to have evolved from a simple system that worked." He follows it with the mean half. A complex system designed from scratch never works, and you have to start over with a simple one that does. Martin Fowler made the same point for software in a short 2015 note called Monolith First. A monolith is one program that does everything, the general store of code. Fowler noticed that almost every success story about splitting a system into many small services began with one big system that got too large. He also noticed that the teams who began with many small services mostly ended up in what he politely called serious trouble. Fowler has spent decades writing down what working teams learn the hard way.
One general setup also carries more than I'd have guessed. Nick Craver, who helped run Stack Overflow, published a day of their traffic from February 2016. The site answered about 209 million requests that day from one main application on eleven web servers and four database servers. He adds that they'd tested running it on a single web server and it worked. He doesn't recommend it.
Discord started this way with one general database. Their co-founder Stanislav Vishnevskiy tells the story on the company's engineering blog, in a 2017 post called How Discord Stores Billions of Messages. The first version of Discord was built in under two months in early 2015. Everything sat in one general database, and he says that was on purpose. His line is one I'd put on a wall: build quickly to prove out a product feature, but always with a path to something sturdier.
Then one job outgrew the store. Around November 2015 they passed 100 million stored messages. The messages and their index no longer fit in the machine's memory, and response times became unpredictable. That was the signal. They moved the messages to a database built for that job. Everything else stayed where it was. Most companies publish only the victory lap, and Discord published the reasoning.
They started general and they watched. One job got heavy enough to measure, and they moved that one job.
Which job gets heavy first depends on the particular build. For a chat app it was messages. For the client in this story it was film.
So how do you tell which job has outgrown the shelf, and what do you do when one does?
A wizard's broken crystal probably gave us the word shard
I move a job off the general platform when the need and the gain both call for it. Engineers call that sharding, and most business owners have never heard the word used that way. It has a better origin story than most business jargon, so here it is.
A game designer in 1996 needed a reason to run one world many times. Raph Koster was working on Ultima Online, one of the first games where thousands of people shared one world. The team worked out that a single copy of the world couldn't hold everyone. They'd have to run several whole copies side by side. Koster wanted a reason inside the story. In the first Ultima game an evil wizard named Mondain traps the world inside a crystal, and the hero shatters it. So Koster wrote that every broken piece of the crystal held its own copy of the world. Each server became a shard.
Koster tells this himself in a 2009 post, Database "sharding" came from UO?, and he doesn't oversell it. He says he isn't sure his afternoon of lore is where the database word came from. There's a rival claim, a 1980s research system whose name spelled out SHARD. I couldn't settle it and neither can anybody else I found. The engineers at Notion, a tool I use every day, repeated the crystal story when they wrote up splitting their own database in 2021. I'm telling it as the likely origin and a good story. Koster wrote it down and left the doubt in, which is why the story can be trusted as far as it goes.
Notion's post has a second lesson in it, and it's the one from the last chapter. One database served Notion through five years and a ten-thousandfold growth before they split it.
I use the word more loosely than a database engineer does. A database engineer means one table split across many machines. I mean something a business owner can act on. A responsibility that used to live on the general platform gets its own home. When one job needs a specialist, it moves to one. For this client's films, the specialist was Mux.
Figma did the version I mean. Tim Liang describes it in The growing pains of database architecture. In 2020 Figma still kept most of its records in one large database, and at peak traffic that machine's processor ran above 65 percent. They left most tables where they were and moved groups of related tables into databases of their own, one group at a time. The first move was two busy tables. The last one, in October 2022, was fifty. Liang gives the two tests they used to pick a group: moving it had to take real load off, and it couldn't be tangled up with what stayed behind.
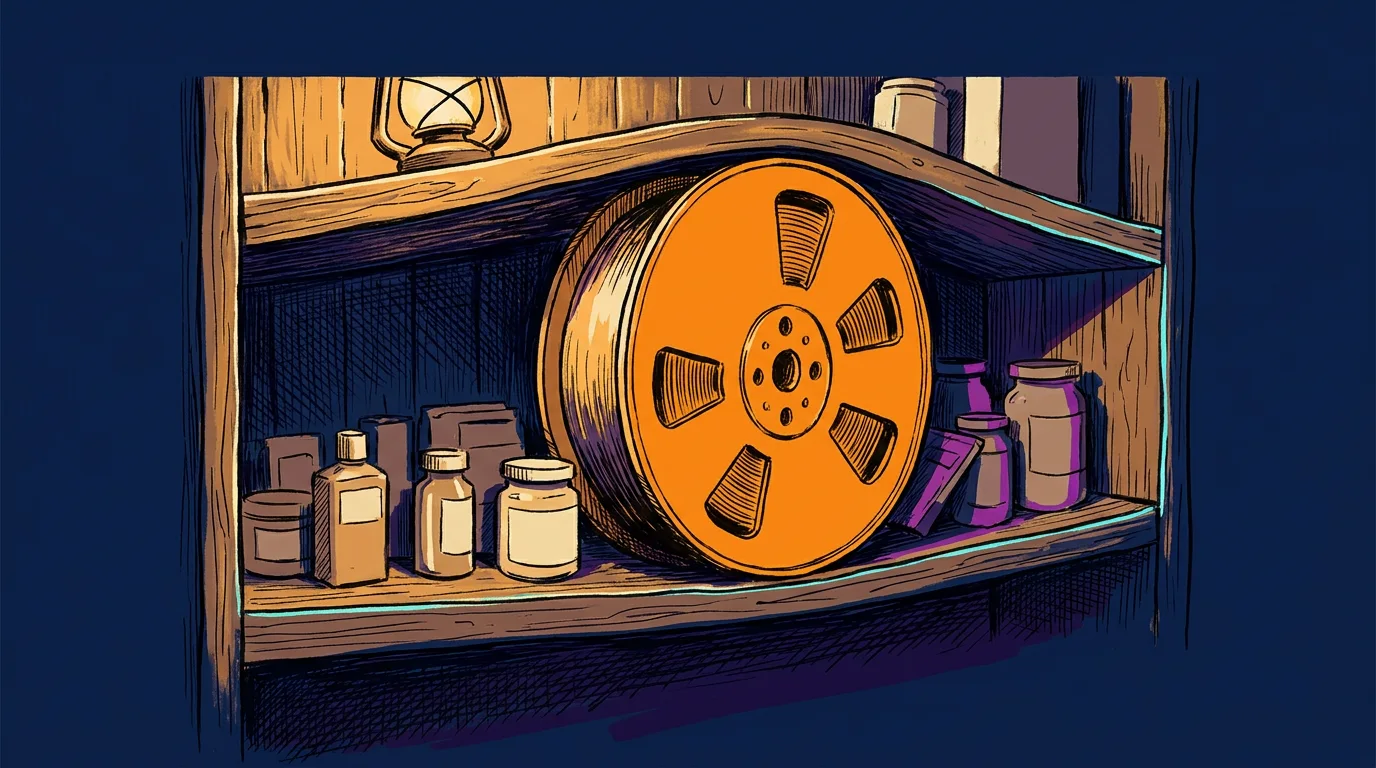
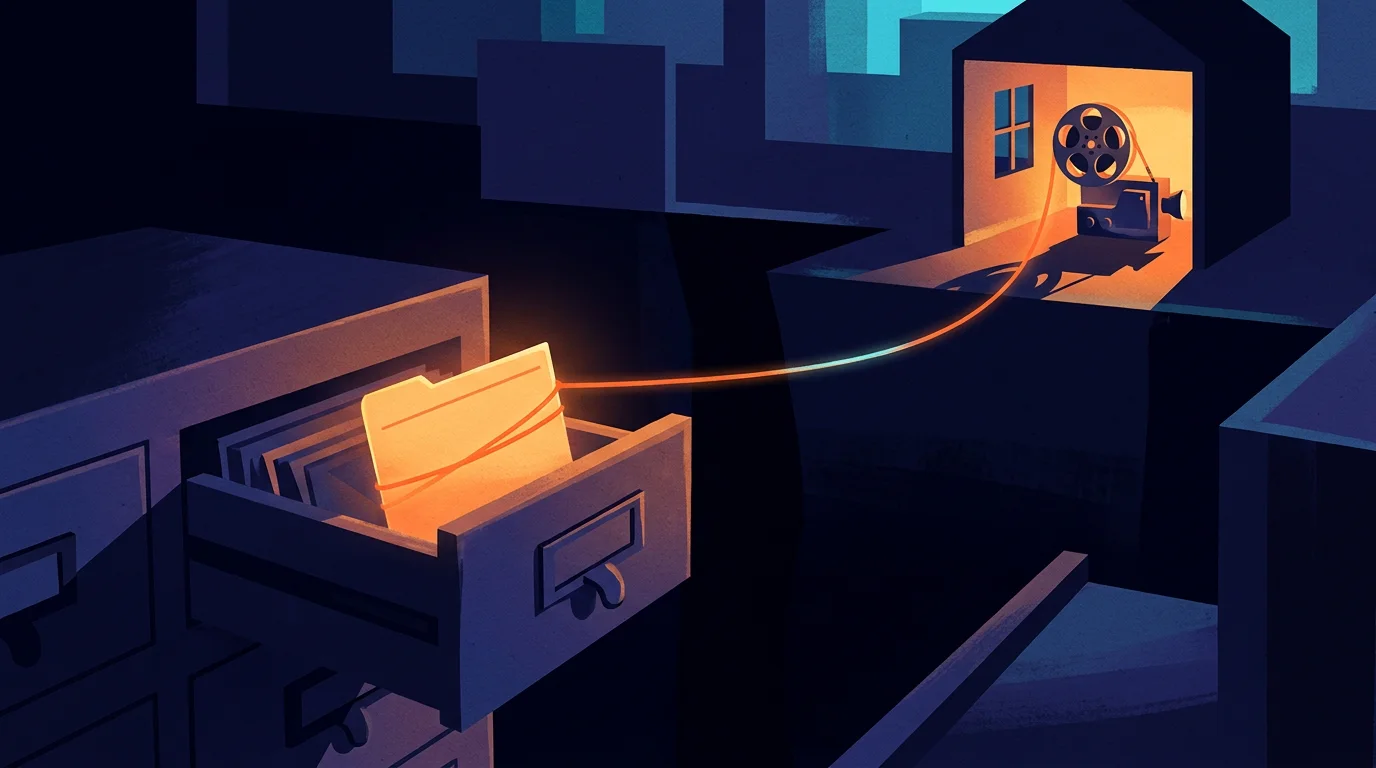
Only a playable copy of each film moved to Mux. This is the bit that's easy to get wrong about a split. I pictured a moving van myself. It was closer to moving one filing cabinet. The film's title, who may watch it, and every comment a reviewer leaves under it all still live in Convex. Mux holds the copy that plays. The two are joined by one short id that sits beside the film's record. When somebody presses play, the page hands that id to the player, and the player asks Mux for the picture.
That id comes back later in this article. A title can change and a cut can be replaced. The id is the thread that lets two systems agree they're talking about the same film. When you split a job off, the thing you're building is the thread back.
The test was worth running whichever way it came out. If the numbers looked reasonably positive we'd bring more of the video platform over, and if they didn't we'd carry on as we were. Either way the experiment was worth it. The numbers came back the way Part 1 laid out. A paid minute of this library costs about 6.1 to 6.8 times more to deliver from the general platform than from Mux's 1080p rate, and Mux's first 100,000 delivered minutes each month are free. Those are modelled from rate cards and measured file sizes. That was enough, so Mux became the standard home for video in the build.
Nine routes still play video the old way. On 20 November 2026 the review films and the video library were playing from Mux. The same audit found ten other places that still played video the old way. One of them, the presentation a client watches, moved to Mux that same afternoon. The other nine are still being moved, and a migration that's announced and a migration that's finished are different things, and anyone who shows you only the bridge is hiding the ferries.
That went well. So why don't I do the same thing with every other job on the platform?
I'm leaving Qdrant on the shelf until a real job needs it
There's another specialist I'm tempted to reach for, and it's called Qdrant. It's a vector store, which is a database built for one job: finding things by meaning instead of by exact words. You type "a machine working near the edge of a cut" and it finds the clip even if nobody ever wrote those words down. Part 3 is about how that works. For now, just know that I think it's one of the most fun tools in the whole field.

This client doesn't need Qdrant yet. I'd enjoy installing it, and that's exactly the reason to be careful, so the line is written down and checked. I get paid to add things. I've never once been thanked for a tool I didn't install.
The numbers are on my side for now. Convex already has search by meaning built in. Its published limits allow a vector of up to 4,096 numbers, and I use 3,072, so we fit. Its documentation says it supports millions of vectors today. The footage map for this Construction and Engineering industry client held 39,630 items the last time it was counted. I'm tens of thousands of items into a room built for millions. The general store has a whole empty aisle left.
Qdrant's own makers say the same. Qdrant published an article called Do You Need Dedicated Vector Search? and its summary says you don't need a vector database for simple search over a small amount of data. Then it says this: "We genuinely recommend starting with whatever you already have in your stack to prototype." A vendor telling you when not to buy their product is rare, and it's the mark of people who know their tool is good. It's a big part of why I'll trust them on the day my answer changes.
A tool crosses the line when three questions all come back yes. First, is a real job hurting today? With video I could point at a play button and a meter. With search, nobody has come to me and said they couldn't find a clip because the store was too slow or too small. Second, can I price both routes on the same work? With video I had two rate cards and one set of films. With search I don't yet have a set of real requests that the current setup fails. Third, do I know who looks after the extra copy? The moment I add a second store, every clip's numbers live in two places, and somebody has to keep them matching. One engineer I read put that chore in terms I can't print here.
Mux got three yeses. Qdrant gets a no on the first question. That's the whole decision.
I went looking for a referee who'd tested the general route against Qdrant at a size that would scare me. The closest I found was a 2025 benchmark from Tiger Data on 50 million vectors. They sell a general database, and they say so up front. Both routes answered in under a tenth of a second. The general database handled more searches per second, and Qdrant kept its slowest searches faster. Their general database isn't Convex, so I can't carry the numbers over. What I can carry over is the shape: at more than a thousand times my collection, the generalist was still in the fight.
Engineers have a proper name for writing your line down so it can be checked. Neal Ford, Rebecca Parsons and Patrick Kua call it a fitness function in their book Building Evolutionary Architectures. It's a test you agree on in advance that says whether a change kept the system healthy. Their book gave me the word evolutionary, which you'll see me borrow before this part ends.
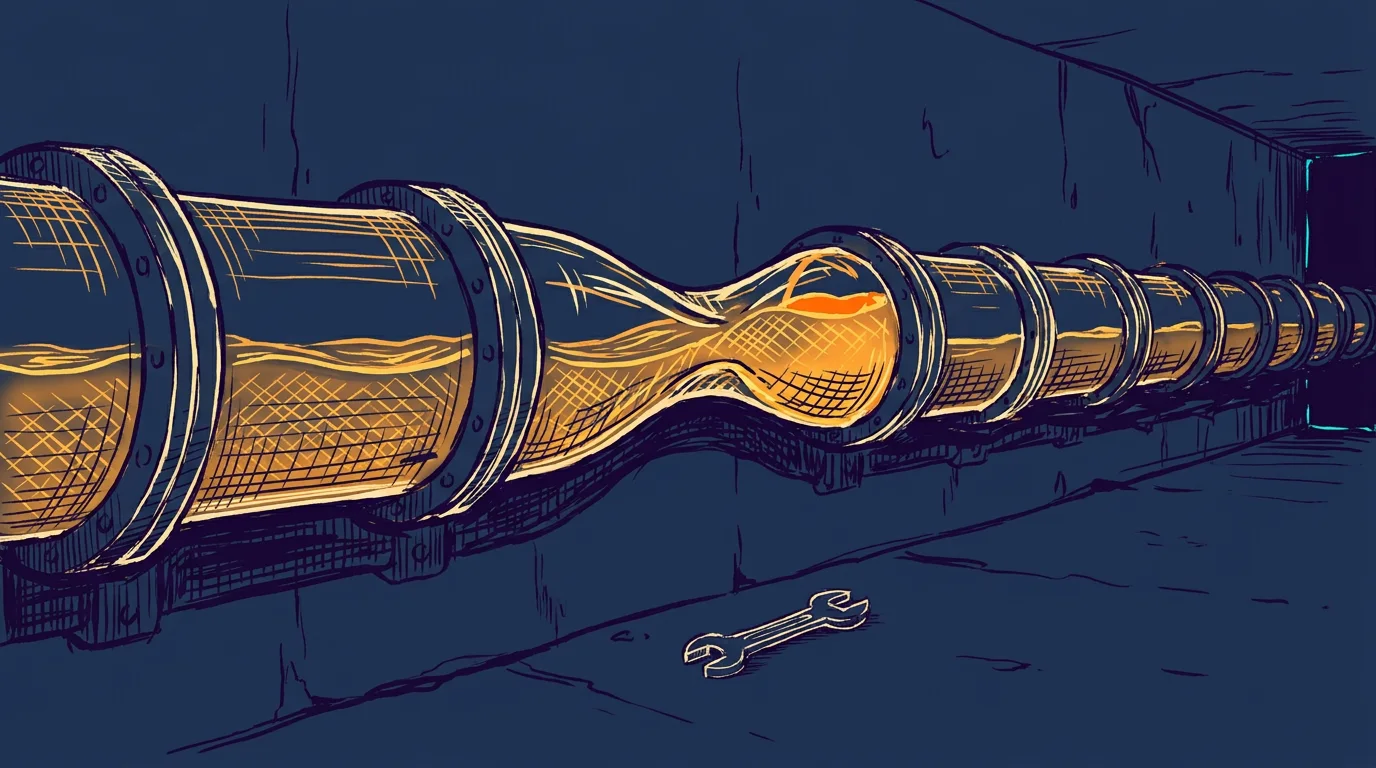
I'll also tell you what flips the first switch. If people start filtering every search down to one small slice of a much bigger collection, or the collection grows past what the general platform holds comfortably, or search by meaning becomes the main thing the product does, I'll run both side by side on real requests and let the result decide. The line moves when the facts move. It doesn't move because I got bored on a Tuesday.
I could still be accused of being stingy. What's the harm in saying yes a little early?
One team ran 140 services and then folded them back into one
The harm has a number, and other teams have already paid it.
Segment split one job into more than 140 pieces and then put them back. Segment's product takes a company's customer events and forwards them to other tools. In the beginning one program did all the forwarding. When one destination had a bad day, everybody's data backed up behind it. So they gave each destination its own small service, which is a perfectly sensible reason to split. Then they kept adding destinations, a few every month. Nobody ever decided to run 140 services. Each decision was only ever to add one more.
Alexandra Noonan wrote the account in 2018, in a post called Goodbye Microservices. By then a change to one shared piece of code meant deploying more than 140 services. The team was, in her words, literally losing sleep. They folded everything back into one service. In the year before the move they'd made 32 improvements to their shared code. In the year after, they made 46. She also lists what they gave up, and says in a later talk that other parts of the company still run as small services and work great. She's telling you how the trade went, without picking a side for you.
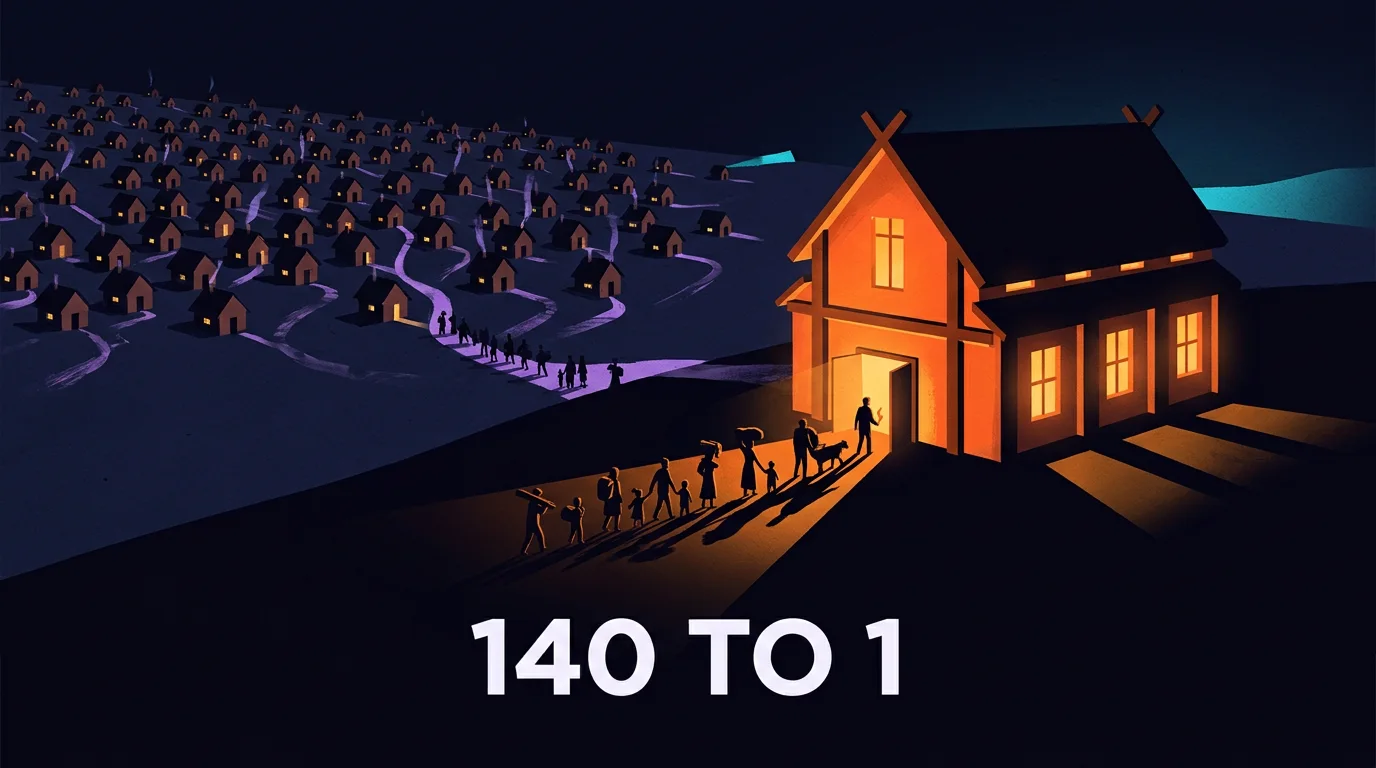
A team inside Amazon cut a bill by more than 90 percent by un-splitting. In 2023 Marcin Kolny wrote up how one team at Prime Video rebuilt the tool that watches streams for picture and sound problems. The first version was a chain of small cloud services passing video frames to each other. The passing was the expensive part. They packed the pieces into one program so the frames moved inside memory, and Kolny reports the infrastructure cost dropped by over 90 percent. That post got passed around as Amazon giving up on small services. It was one team's monitoring tool, and Amazon didn't abandon anything. Kolny says plainly that the choice has to be made case by case, which is the most useful sentence in his post.
So here's the pattern across both. A split bought something real on day one. Then the cost showed up in the gaps between the pieces.
Discord moved its messages twice and had a measured reason each time. Remember they moved their messages when the general database ran out of memory. Bo Ingram picks the story up in a 2023 post, How Discord Stores Trillions of Messages. That message store ran on 12 machines in 2017. By early 2022 it ran on 177, and the on-call engineers were being paged constantly. They moved the same job again, to a different specialist, and ended up on 72 machines. Fetching old messages went from somewhere between 40 and 125 milliseconds at the slow end to a steady 15. Ingram is funny about it too. He says it's fine to call the new database quiet because he isn't on call that week. Each time, they moved one job, for a reason they could measure, and they could tell you afterward what changed.
Somebody has to stand in the gap that a split leaves. My own small version looks like this. Somebody attaches a new cut of a film to its record. The record updates in a blink. The new stream at Mux takes a little while to get ready. For that little while, one system says the new cut exists and the other can't play it yet. The two clocks show two times, and both are right. Somebody has to decide what the viewer sees in that gap, and somebody has to notice if the "ready" message never arrives.

That's one gap, from one split, and I can hold it in my head. This is how all microservice architectures work. Every piece you break off gives you a gap and a person-shaped job beside it. Two or three are a fair price for a 6x saving. A hundred and forty is a second company you didn't mean to start.
So far this has been a story about software. It's also a story about any business that runs on more than one tool. How many does yours run on?
Every company I've worked with already runs a split system
I asked because I've never met an owner whose answer was one. The ones I work with have a place for customers, a place for tasks, a place for documents, a place for money, a calendar and an inbox. Nobody designed that as an architecture. They've been running a split system for years, and the owner has been doing the bridge job personally, mostly from memory.
Okta, a company that manages logins for businesses, counts this every year. Its 2024 report on smaller companies found that businesses with 50 or fewer employees ran an average of 36 different apps, and businesses with up to 500 ran 58. That only counts the apps wired into Okta's login, so I'd treat it as a floor. Thirty-six rooms, in a company small enough to share one pizza order.

My own company's knowledge sits in five tools and I treat it as one graph. A knowledge graph is a plain idea with a fancy name. It's a set of things and the connections between them: this film belongs to that project, which answers that request, which follows that guide. Amit Singhal gave the idea its best three words when he introduced Google's version in 2012: "things, not strings." A search engine that only matches letters sees two words in Taj Mahal. One that knows about things can tell a monument from a musician. In my case it lives in five tools: one for documents, one for client records and who's doing what, one for each unit of agent work, one for the data records and one for the films.
We're talking about using Neo4j a lot more for the actual graph. That's a database built to store connections as the main thing, and it would be another shard, so it has to pass the same three questions. Even scattered across several tools, it is already a working knowledge graph, because that's what any split system becomes.
Something has to carry each fact from one tool to the next. Call it the carrier. It's the small piece of work that carries a fact from one room to the next and keeps the thread intact. Sometimes it's a few lines of code. Sometimes it's an agent. In a lot of the companies I've worked with it's one person. I'll call her Linda. She's been there eleven years and knows where everything is. Linda is a single point of failure with a pension. I say that with love. The job of a good system is to write down what Linda knows, so the thread survives her taking a holiday.
Each kind of data needs one owner and a few shared rules. Zhamak Dehghani gave this arrangement a name in 2019 and a full book in 2022: data mesh. Her four principles translate well into owner's language. The people closest to a kind of data own it. They treat it as a product that other people can use. There's a shared platform so each team isn't building its own plumbing. And there's a small set of rules everybody follows, enforced by the machines where possible. The fourth is the one I see skipped. It says a film id means the same thing in every room. She insists that this is about people as much as pipes, and the book is worth the effort.
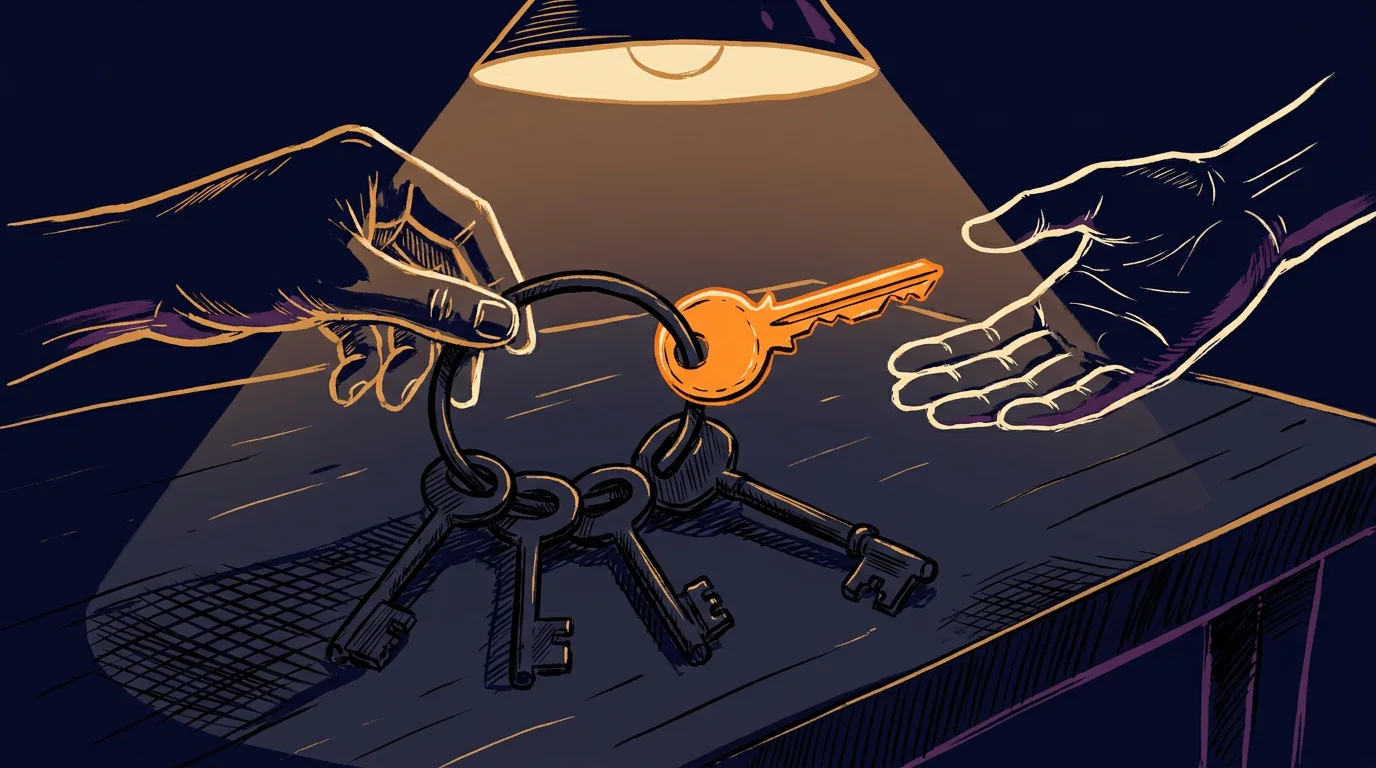
Here's a test you can run this afternoon. Pick one thing your company made last month: a proposal, a video, a quote. Try to find who owns it today and what the last change to it was. Then ask the newest person on your team to do the same without asking anyone. The difference between your time and theirs is the size of your Linda problem.
I've been describing a habit and borrowing other people's names for parts of it. So what do I call the whole thing?
I'm building a pattern that nobody can download
On paper, what we built for this client is called a content factory. What we really built is a functioning prototype of a way of arranging software. I call it an evolutionary data mesh ecology, and each of the three words comes from someone careful.
I borrowed each of those three words from somebody careful. Evolutionary comes from Ford, Parsons and Kua, who define the idea as supporting "guided, incremental change across multiple dimensions." That's the general store, the single shard and the three questions, in a few words. Data mesh is Dehghani's: owners, products, a shared platform and shared rules.
Ecology is the one I picked myself. It's an ecosystem too, in the sense the botanist Arthur Tansley gave that word in 1935, living things and their surroundings forming one system. But ecology is the study of how those relationships work, and that's what I'm after. I care less about which tools are in the pond this year and more about the rules by which a new one earns its place.
I can follow the same steps for the next client with different tools. This isn't code that you copy and paste. It's a pattern, not a piece of software. If I've done it properly, I should be able to follow the same pattern for the next client with half the tools swapped out. The architect Christopher Alexander and his co-authors defined a pattern in 1977 better than anyone has since. Each one describes a problem that keeps coming up and the core of its solution, "in such a way that you can use this solution a million times over, without ever doing it the same way twice." Alexander was writing about porches and town squares. Software people borrowed his idea decades ago and never gave it back, and I'm glad they didn't.
So it's a skill set for how to think about solving problems. From here it's a matter of which problems are valuable enough to solve.
If an engineer asked, I'd call it an architecture for an agent-native data platform. That means a place built so software agents and people can both find a thing, tell who owns it and trust what it says. It holds inert data, and anything private gets anonymized before it travels.
Once one client's world is defined most of the next one is already built. By a world I mean the things a business has, their fields and the connections between them. When you take the time to define one properly, most of the job is already done for the next one. My rough, unmeasured estimate is about 80 percent. You extend the world to the 20 percent you care about.
That only works if every world is built from the same kind of brick. So the pattern starts with one move, before any tool gets chosen. You break the thing down into its fundamental parts.
A film, a comment, a guide, a task and a stream live in five different rooms and look nothing alike. What could possibly be the same small brick inside all of them?
I turn every file into 3,072 numbers so one person can read a library
At the end of the last part I called this whole thing a pattern, and I said it's a skill set for thinking about problems more than a piece of software you copy and paste. A pattern has to start somewhere. Mine starts with one question, and I ask it before I pick a single tool. Break the problem into its smallest parts, and find the smallest unit of the thing you care about. Start there.

A trade gets good at counting after it agrees on its smallest unit
Physicists use the word quantize for the discovery that energy comes in tiny fixed packets. I use it for a plainer habit. Before I measure anything, I decide what one of it is.
A steel box cut the cost of loading a ship by about 97 percent. Marc Levinson's The Box is the best book about a boring object I've ever read. Before 1956 a ship was loaded by hand. Dockworkers carried barrels, crates, sacks and bales aboard one at a time, and it took days. Then a trucking man named Malcom McLean had 58 truck bodies lifted onto a converted tanker called the Ideal X, and it sailed from Newark for Houston on April 26, 1956. Levinson reports what McLean's accountants found afterward. Loading loose cargo cost $5.83 a ton, and loading the Ideal X cost 15.8 cents a ton. The ship was an old tanker. McLean saved that money with one decision. Cargo would be counted in boxes, and every truck, crane and ship would be built around the box. Levinson is careful to say that McLean wasn't the first man to put freight in a metal box. McLean was the one who rebuilt the whole trip around the unit.
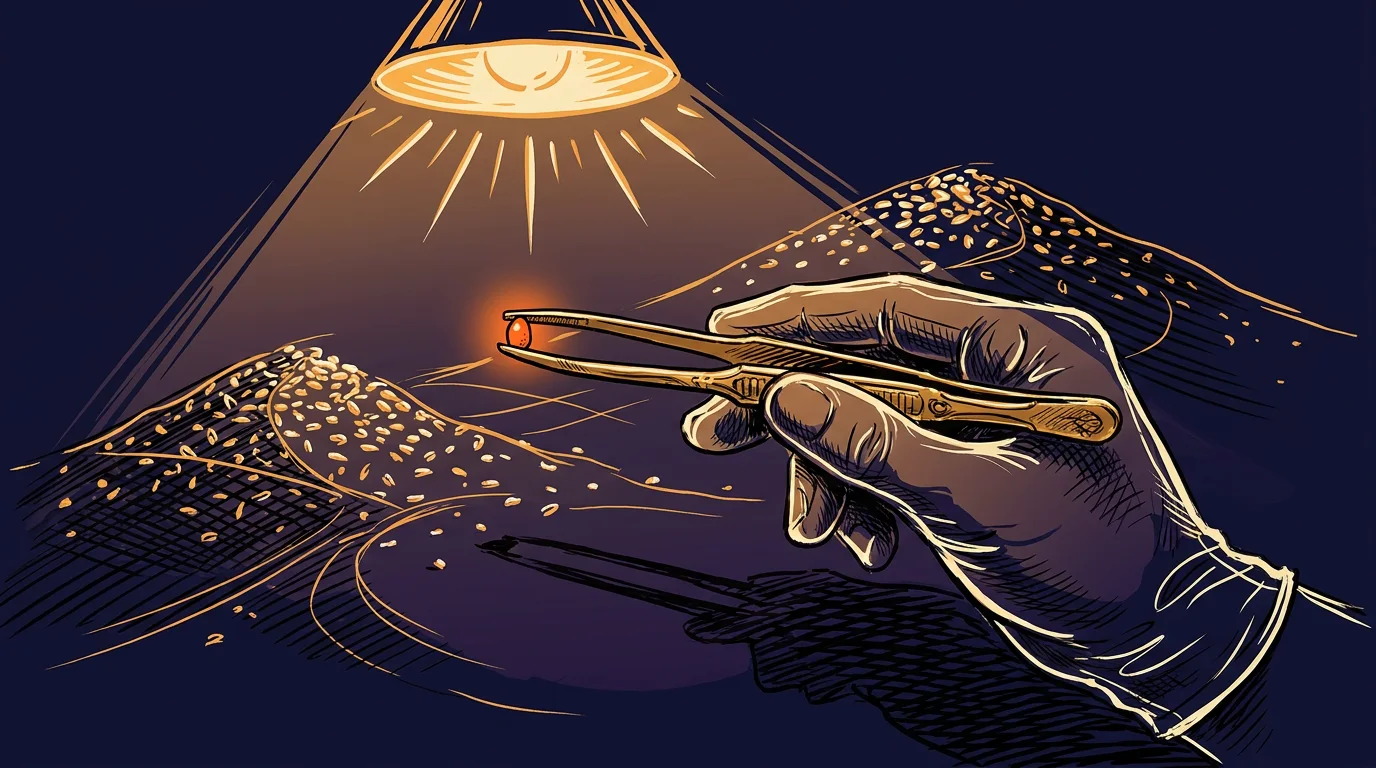
The same thing had happened to communication eight years earlier. In 1948 Claude Shannon published "A Mathematical Theory of Communication" and gave information a unit, the binary digit. He shortened it to "bit" and credited the word to his colleague John Tukey in the same sentence. He stopped in the middle of the most important paper in his field to credit a colleague for a three-letter word. Before the bit, a telegram, a phone call and a photograph were three separate engineering problems. After it, an engineer could treat all three as the same problem at different sizes.
A good unit does three jobs. It's small enough that I can see each step of the work. It means the same thing to two people who've never met. And I can add it up without arguing about what I'm adding. The box does all three for freight, and the bit does all three for a message.
I spent years counting in impressions. My own trade has its unit too. In performance advertising the unit is the impression. One impression is one ad served to one screen. The standards people even argued out what counts as a real chance to be seen. The Media Rating Council's guideline says at least half of a display ad's pixels have to be on screen for one continuous second, and two seconds for a video ad. Somebody sat through a lot of meetings to settle that, and it lets two advertisers on opposite sides of the planet compare numbers.
Counting that small changes how I build. A unit that small shows every step a buyer takes, so every step can be measured and improved.
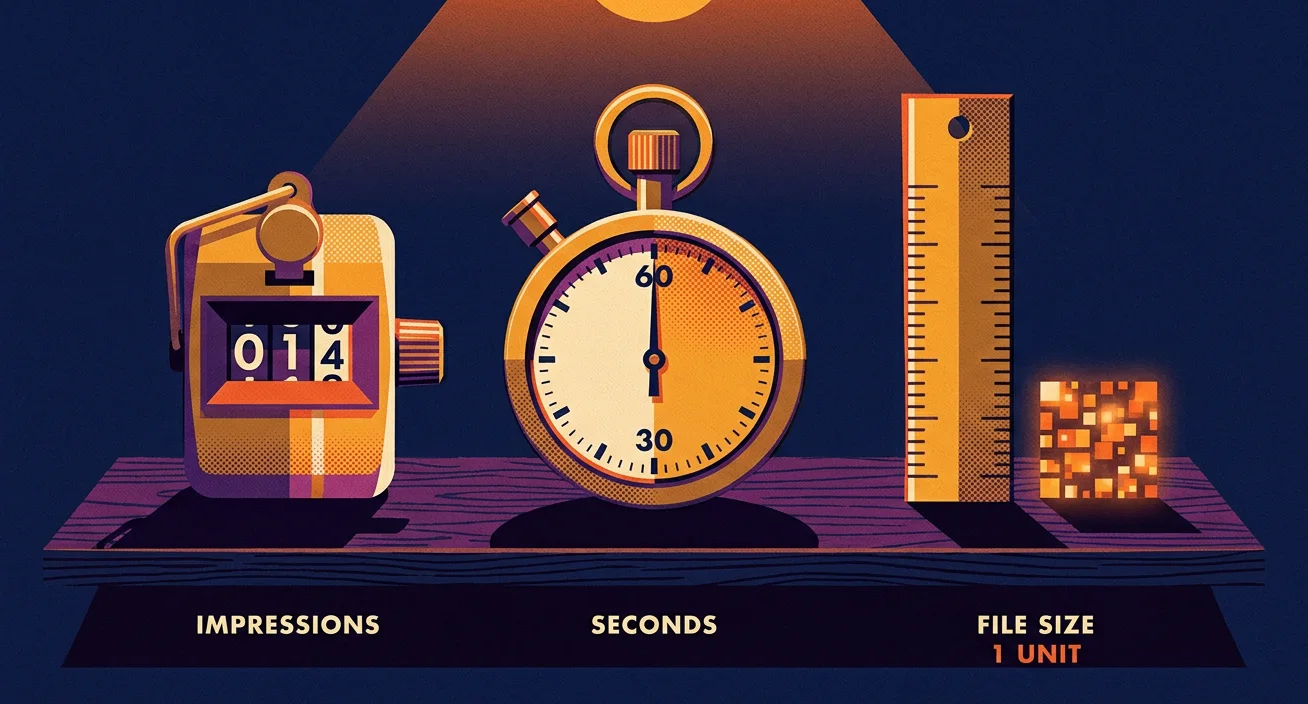
The video bill works the same way. The video bill in the first part only made sense once I stopped asking what a library costs and started asking what one delivered minute costs. Mux bills by the minute a viewer receives, and Convex bills by the data that leaves. Once both sat on the same unit, the rate cards came out at about six to one (6.1 to 6.8).
A box works for freight. An impression works for ads. A delivered minute works for a video bill. What's the smallest unit when the business is made of training films, PDFs, slide decks, photos and somebody's voice notes?
If it's a file I chop it up and turn the pieces into numbers
For us, that unit is the vector embedding. It's a long string of numbers, 3,072 of them in the model I use. The name is ugly and the idea is simple. If it's a file, we'll chop it up into pieces and turn it into numbers. Every file is cut into pieces, and every piece becomes a list of numbers.
I chop first because an embedding model only accepts small inputs. The model I use is Google's Gemini Embedding 2. Google's documentation sets the size of one request at 8,192 tokens of text, six images, 120 seconds of video, 180 seconds of audio or six pages of a PDF, and it recommends one PDF page at a time for quality. A two-hour training film is nowhere near that, so it gets cut into short clips. A manual gets cut into passages of a few sentences. I cut where the meaning breaks, the way an editor cuts a film between scenes. A cut in the middle of a sentence gives me two pieces that each mean nothing.
Every piece also keeps its address: which file it came from, which page, which second. The numbers find the piece, and the address lets a person open the real thing and check it.
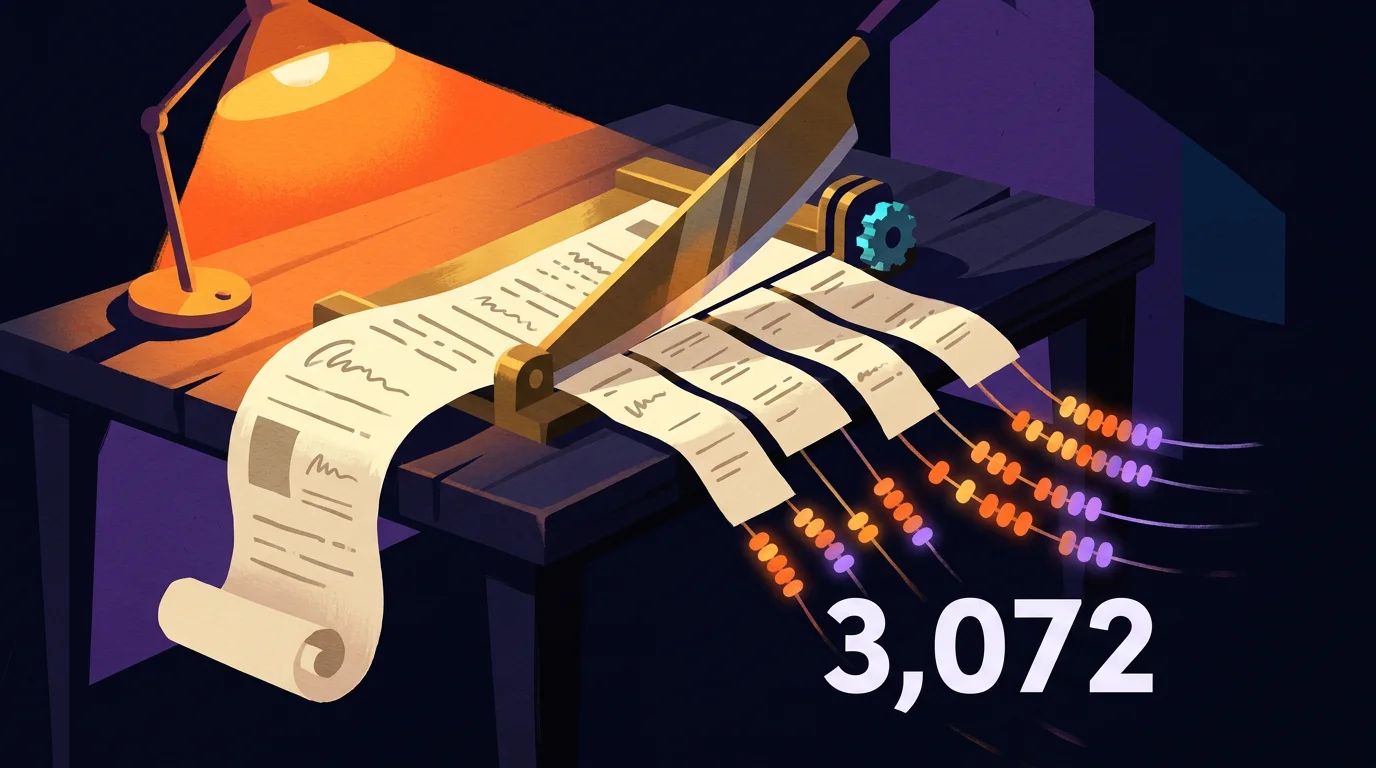
Each piece comes back as 3,072 numbers that work like coordinates. Two numbers can pin a spot on a paper map. Three can pin a spot in a room. A list of 3,072 pins a spot in a space I can't picture, and you can't either, and that's fine. The computer only has to answer one question about that space, which is what else sits close by. Pieces that mean similar things land near each other. A passage about closing the supply valve lands near a question about shutting off the water, and the two don't share a single word.
People ask me what the individual numbers mean. No single one of them means anything I can name. One digit of a GPS reading doesn't tell you where you are either. The whole list is the position, and the position is all I ever compare.
That idea is older than it looks. A British linguist named J. R. Firth wrote in 1957, "You shall know a word by the company it keeps." It took fifty-six years for the arithmetic to catch up with him. In 2013 Tomas Mikolov, Wen-tau Yih and Geoffrey Zweig showed that word positions learned from plain text carried relationships you could do sums with. In their famous example you take the position for king, subtract man, add woman, and land close to queen. It's still the best party trick in my field, and a non-technical person can repeat it at dinner.
One model puts pictures, sound and words in the same space. This is the reason the embedding is my atomic level and a word or a page isn't. It takes images, video, audio, PDFs and slides alike. Google released Gemini Embedding 2 in preview on March 10, 2026, and made it generally available that April. Their announcement says it maps text, images, video, audio and documents into one embedding space. Before a model like that, I'd have needed one model for words and another for pictures, and the two sets of numbers couldn't be compared. It would've been a price list in dollars sitting next to a price list in pesos with no exchange rate. Now a typed question can land next to a photo, a clip or a slide, and I can ask which of them is closest.
For an owner, that means a photo of a whiteboard, a recorded sales call and a proposal PDF stop being three separate archives. They become rows in one table, and one question searches all three.
The dates and limits are Google's, and I've read them off Google's own pages. The 3,072 is the model's full default size. Google will hand back shorter lists, 1,536 or 768 numbers, for anyone who cares more about storage cost than about the last bit of quality. We keep the full list. That one release removed a whole layer of plumbing, because a single model now handles every kind of file.

So every file I own is now a pile of same-shaped pieces, and every piece is a row of numbers with an address. A pile of numbers is still a pile. What can anybody do with it?
My favorite tools from before chatbots still work on these numbers
Once everything is a row of numbers, a lot of older tools start to work on it. Some of the tricks are new. Most of my favourites are old.
Before chatbots, my tool of choice was XGBoost, especially for text analysis. It came out of a research project by Tianqi Chen. He wrote later that he built it because no existing tool did what he needed, and that he half expected it to sit on GitHub forever like any other pile of old research code. Then he tried it on a physics competition, the Higgs Boson challenge on Kaggle, and by his own account it surprised him by jumping to first place on the leaderboard. He and Carlos Guestrin wrote it up properly in 2016, in a paper that says the system scales past billions of examples.
What it does is easy to say out loud. It builds a small decision tree, which is a short run of yes-or-no questions. That first tree gets plenty wrong. So it builds a second small tree that studies only the first one's mistakes, then a third that studies whatever is still wrong, and it keeps going for hundreds of rounds. Each tree on its own is weak. A few hundred of them stacked together are hard to beat on a table of numbers.
A table of numbers is exactly what a library of embeddings is. Every piece is a row, and every row has 3,072 columns. In 2024 Gjergji Kasneci and Enkelejda Kasneci tested the pairing directly. They fed embeddings from language models into tree models, XGBoost among them, next to ordinary columns, and reported that the added features often improved the predictions. They checked what a lot of us had assumed. The twelve-year-old tool and the brand-new one get along. If I want to know which pieces of a library keep showing up in the ads that worked, a table and a few hundred small trees can tell me, and they cost almost nothing to run.
A chatbot is one thing an owner can do with a company's knowledge once it's in numbers. Sorting, scoring, grouping and forecasting are four more, and all four were solved problems before the chatbots arrived.
NLP means two different things, and both matter here. To a programmer it's natural language processing, the field of getting machines to work with human language, and its first working systems date to the middle of the 1950s. To a hypnotherapist it's neuro-linguistic programming, which Richard Bandler and John Grinder started in the early 1970s by studying what unusually good therapists did with their words. I'd never sell the second one as medicine, because a 2012 systematic review found little evidence that it improves health outcomes. I use it as a set of questions about how a sentence lands on a person.
Both of them apply here. One is how a machine reads words, and the other is how words move a person. A model of a reader needs both: how the machine reads the words, and how the words will land on the person. For now the numbers are enough, and the numbers are positions. So what does the map look like?
Pieces that mean similar things land next to each other
I can ask for the nearest neighbours of any piece. Pick one piece. Say it's a ten-second clip of a hand changing a setting on a machine. I ask the computer for the twenty pieces closest to it. Back come other clips of the same move, the manual page that describes it, a photo of the screen, and a voice note where somebody explains it badly. Nobody tagged any of those. They sit near each other because they mean nearly the same thing. That's neighbourhood analysis, and it's most of what a search is doing when it finds something for you.
A customer describes a fault in the customer's words. A technician wrote the fix in the technician's words, three years ago, in a note nobody remembers. A keyword search needs the two of them to have picked the same words. A neighbour search only needs them to have meant the same thing.

Groups show up without anyone tagging them. Clustering is the other half. Instead of starting from one piece, I ask the computer to find the crowds. Where do the pieces bunch together, and where is it empty? I call each crowd a village. The method I lean on is called HDBSCAN. Ricardo Campello, Davoud Moulavi and Joerg Sander published it in 2013, and its best feature is that it's allowed to decide a piece belongs to no crowd and leave it alone. To look at any of it I flatten the 3,072 directions down to two or three with a tool called UMAP, which Leland McInnes, John Healy and their co-authors released in 2018. Between them I get a map of my own material that I didn't have to draw.
A village on that map might be every piece about one kind of mistake a crew makes. Another might be every piece where a customer sounds relieved. Nobody chose those groups ahead of time. They were already in the material, and all I did was name them.
A good metaphor is a jump between two far villages. Take a bill nobody checked and a swimmer out of sight of land. They sit in villages a long way apart, and a sentence that joins them makes both easier to feel. Part 5 comes back to why a jump like that lands on a reader.
So this is why we use clustering and neighbourhood analyses. The neighbours show me what's obvious. The clusters show me where the villages are. Once I can see the villages, I can go looking for a bridge on purpose, between two that nobody has joined for this reader before.
Your closest piece can say the opposite thing. There's a snake in this particular grass. Near only means two pieces are about the same subject, and two pieces about the same subject can flatly disagree. In 2025 Hongliu Cao tested a range of current embedding models on pairs of sentences where one was the plain negation of the other, the white horse against the horse that isn't white. He concluded that the models lack negation awareness and score a sentence and its negation as roughly similar. He measured a thing my trade keeps getting bitten by. He didn't test the model I use, and I haven't run his test on ours, so I treat it as a warning about the whole family.
In practice it means "tighten the bolt before you start the machine" and "never tighten the bolt before you start the machine" are next-door neighbours. A search will hand you both with a straight face. The numbers find the street, and a person still has to read the house number.

That's the trouble one small folder can cause. What happens when I do this to every book I own?
I stopped reading books and started reading libraries
Reading was trouble for me and now I read by the shelf. I'm a human operator with special needs when I'm using a computer. I have a weird form of dyslexia, and I've gone from having trouble reading to being able to read entire categories of hundreds of textbooks. Instead of reading one book at a time, I read a whole library at once: every word of every book, sorted into clusters I can filter.

On an ordinary afternoon I start with a problem instead of a title. The map shows me which villages of passages speak to that problem, across every book at once. I might see that several authors wrestled with the same trade-off, that most of them agree, and that the two who don't are the ones worth my afternoon. Then I open the real pages and read those the slow way. The library tells me where to read, and I still do the reading. My own shelf holds a little over two hundred parsed books.
The overlapping filters are where it gets good. One filter is a subject. Another is a time. A third is a kind of source, like a textbook against a transcript of me rambling. Switch on two of them and I'm looking at the handful of passages where both are true, pulled from books that never cited each other.
A literary scholar had the idea twenty-six years ago. I'd love to claim it. Franco Moretti published it in 2000 and called it distant reading. His complaint was about his own field. Scholars who said they studied the nineteenth-century novel had read a sliver of it, he argued, because tens of thousands of British novels came out in that century and nobody has read them all or ever will. His answer was to stop pretending and study the patterns across the whole pile. He said the quiet part in print.
Ten years later a team led by Jean-Baptiste Michel and Erez Lieberman Aiden did it at scale with the books Google had scanned. Their corpus held 5,195,769 books, about 4 percent of all the books ever published. They worked out that reading only the entries from the year 2000, at 200 words a minute with no breaks for food or sleep, would take a person eighty years. That one sum explains why I needed a different way to read.
They counted words. An embedding counts meanings, and it does it for film and sound as well as print. That's the step from counting words to finding ideas.
One client's library came to 39,630 pieces. The same unit works on a company. For a Construction and Engineering industry client, the media map from our 20 November run held 39,630 pieces: 12,446 clips, 1,158 soundbites and 26,026 pictures.
Before a run like that, a library is years of footage on drives, and a producer who needs one shot of a hand on a control has to scrub through film until it turns up. After it, the producer describes the shot, and the neighbours come back with their addresses attached. Nothing new was filmed. The same material became a thing a person can ask.

So everything is indexed and everything has neighbours. Why does a machine with all of that still hand back an answer that misses?
I check my own work before I blame the AI
I have three suspects every time an answer misses. Most people blame the AI, the way they'd blame a driver for a bad map. I check three things first. The first is the cut. Maybe one piece held what I needed and got chopped in half, and neither half makes sense alone. The second is the numbers. Maybe two pieces that disagree are sitting side by side, like the two bolts. The third is the question. Maybe I asked for a reason, and the library only holds a date.

There's a fourth trap, and it's the pretty map. Flattening 3,072 directions into a picture throws most of the neighbourhood away. I measured that on my own words. We took 32,565 passages of me talking, drew them in three dimensions, and compared each point's fifteen nearest neighbours in the drawing with its fifteen nearest in the full space. On average about one in five survived (the figure was 0.199). Andy Coenen and his colleagues at Google wrote the plainest explainer on UMAP I know, and they warn about the same thing: the distances between clusters on these maps may mean nothing. They put a warning label on their own favourite tool. The picture is for getting curious, and the full numbers are for deciding.
This is the snakes-in-the-grass lesson from the first part, one level down. The map looks like a meadow. A junior operator rolls around in it and ships whatever the nearest neighbour says. Somebody who's been bitten counts the snakes first.
You can use the same suspects on anyone who offers to build you one of these. Ask what their unit is. Ask how they cut a file, and what a piece keeps with it. Ask which model makes the numbers, and how many numbers. Ask what happens when two neighbours disagree. Someone who's done the work answers all four without looking anything up. You don't have to understand every answer to notice whether there was one.
I change one thing and then I look again. It's the cheapest test I know. The questions stay the same, and I change the cut and nothing else before running them again. Then the cut goes back and the model changes. If three things move at once and the answers get better, I've learned nothing I can use next time. I've got a nice demo and no idea which part to pay for.
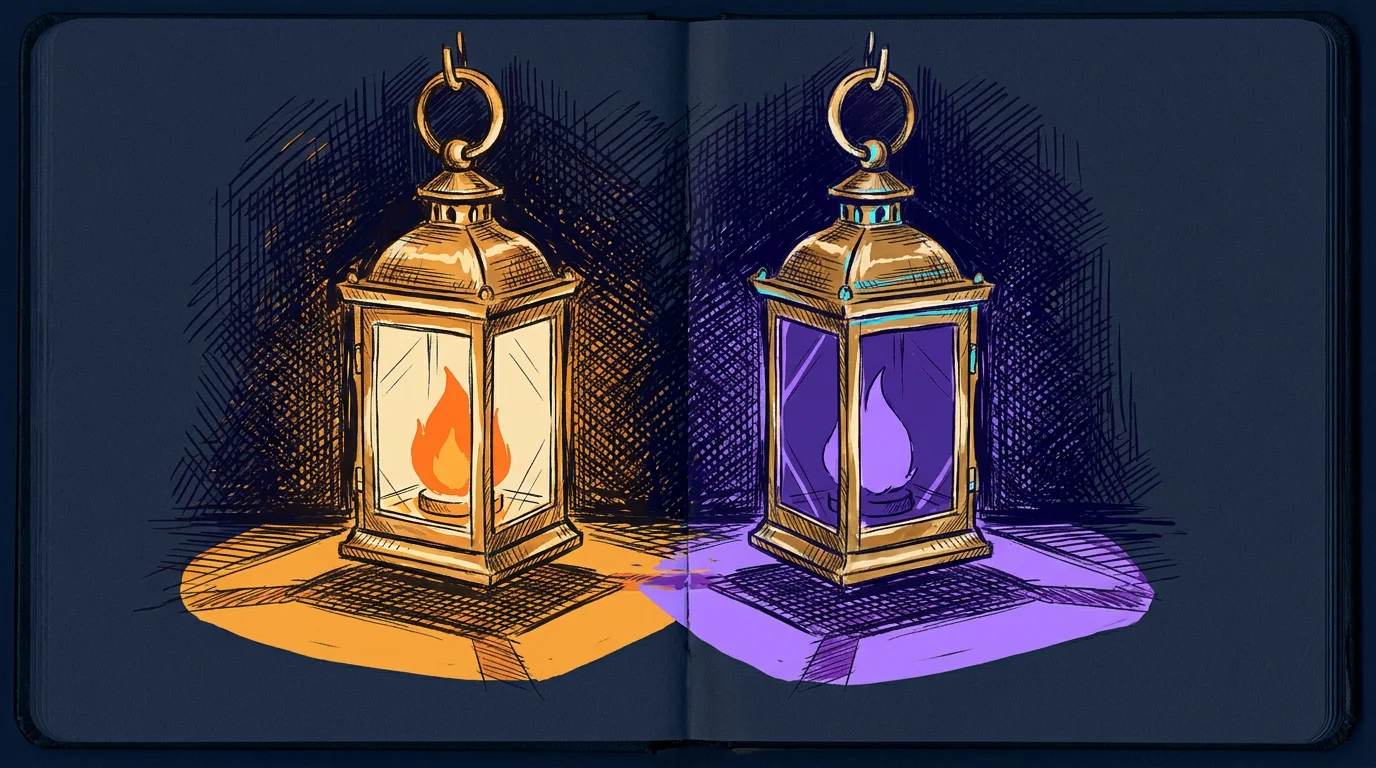
So that's the atom. It's a piece of a file, a row of 3,072 numbers, and a spot on a map with neighbours and an address. Everything after this is built from that one unit, so it has to be right.
A pile of atoms isn't worth anything yet, though. Thirty-nine thousand pieces sitting in a store are as inert as the files they came from. If I can find any piece and all of its neighbours, how do the pieces turn into something a person wants to watch?
I fold a pile of pieces around one purpose and it starts to work
So now you've got a cloud. Every page, clip, photo and slide in the business has been chopped up and turned into 3,072 numbers, and the numbers that mean similar things sit near each other. It's a lovely cloud. It also does nothing. Nobody ever bought a product because of a cloud. This part is about the move that makes the cloud useful.

A string of beads does nothing until it folds
A search hands me pieces and I still have to build something from them. Ask the cloud a question and it gives back the five or ten nearest pieces. That's retrieval, and it's most of what sits behind an AI that "knows the business". It's useful. It's also the same as a hardware store handing you a bag of parts when you asked for a gate. The parts are right. The gate is still your problem. Somebody has to decide what goes where, what holds what up and what the gate is for. I call that step folding, and I stole the word from biology.

A protein is a string that folds itself into a tool. Your body builds proteins as long chains of small parts called amino acids. Laid out straight, the chain is a string of beads. It does nothing. Folded into its shape, the same string becomes an enzyme that digests your lunch or a motor that moves a muscle. In 1961 a biochemist at the National Institutes of Health named Christian Anfinsen showed something that still gives me chills. He took a working enzyme called ribonuclease, chemically unfolded it until it was dead string, and then let it go. It folded itself back up and went back to work. The enzyme has eight spots that can pair off 105 different ways, and it found the one right pairing by itself, every time. The instructions for the shape were in the order of the beads. He shared the 1972 Nobel Prize in Chemistry for it, and his Nobel lecture spends its first page crediting other people.
Then the story gets weird. In 1969 Cyrus Levinthal did the arithmetic on how a chain could find its shape by trying options. The Nobel committee's own summary gives his numbers: a small protein of 100 amino acids can take at least 10 to the 47th power different shapes. Trying them at random would take longer than the age of the universe. A cell does it in a few milliseconds. So the chain can't be searching. Something is pulling it. Levinthal wrote the paradox down and left it for fifty years of other people to chew on.
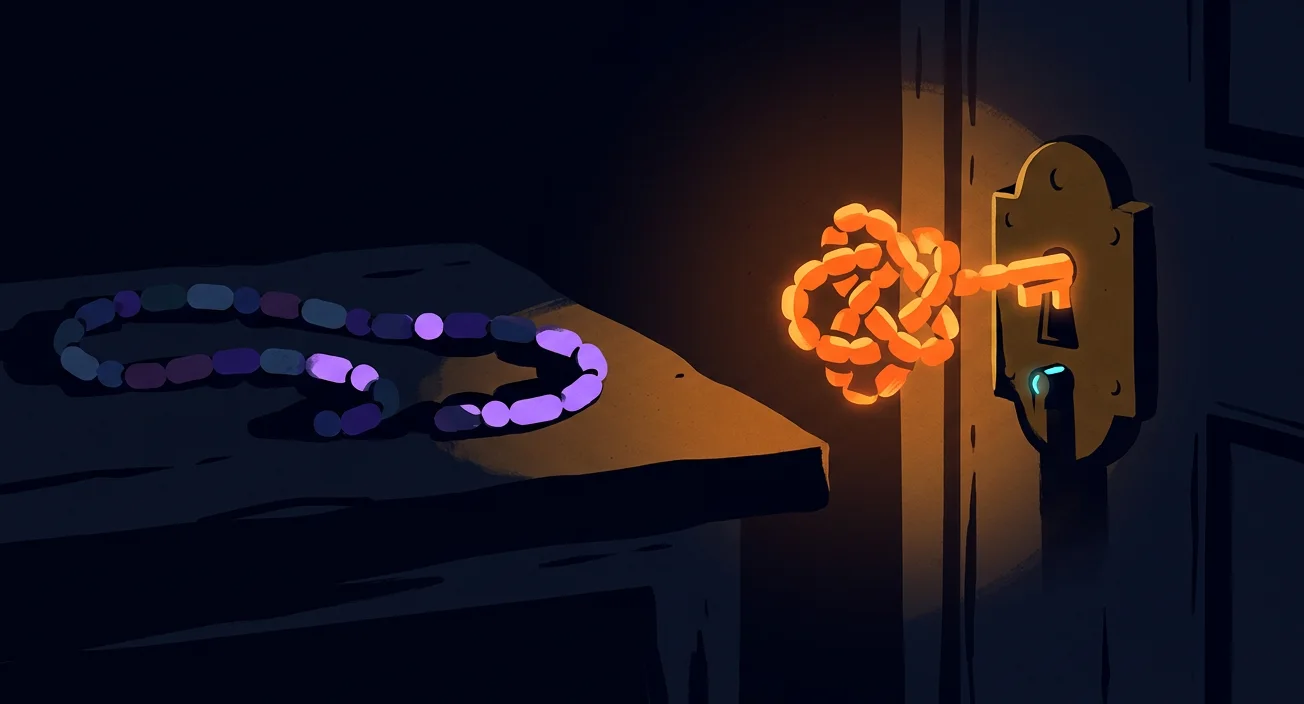
I named my method after a computer that predicts how proteins fold. In 2020 Demis Hassabis and John Jumper at Google DeepMind entered a system called AlphaFold2 in the field's blind test, a contest called CASP. Its median score was 92.4 out of 100, in a contest where about 90 is treated as matching a lab measurement. It has since predicted the shape of nearly all 200 million proteins that science has catalogued. They shared the 2024 Nobel Prize in Chemistry with David Baker, who went the other way and designed proteins that never existed. All three gave me a metaphor I can't put down.
AlphaFold folds a chain of amino acids into a protein that works. I fold a cloud of content pieces into a shape that does a job, and then project that shape into whatever media the job needs. At bottom it is a very elaborate Mad Lib. I call it data folding.
In plain words, a protein is inert until it folds, and the fold lets it do a job. A manual page is inert. A photo of a machine is inert. A clip of two people arguing about a setting is inert. Fold those three around one purpose, like teaching a new hire why the setting matters, and they become a 30-second lesson that works. Data folding does the same thing with content. Change the purpose and the same pieces fold into a different shape.
Try it on one pile. Say the pile is everything a company has about one machine: the manual, forty photos, a dozen clips and the notes from every support call. Fold it for a new hire and you get the three things that go wrong in week one, in the order they go wrong. Fold it for a buyer and you get the two worries that stall the purchase, each with its proof beside it. Fold it for the owner and you get what the machine did for the business last season. Nobody wrote anything new. The pile is the same pile. The shape changed because the question changed.
There's a hole in my metaphor, though, and you may have spotted it. A protein has physics doing the pulling. Charge, water and heat drag the chain into its shape in milliseconds. A pile of manual pages and video clips has no physics. It'll sit in the cloud forever. So what pulls a pile of content into a shape?
Enough force turns almost nothing into a crystal
I picture that pull as a crystal growing out of empty space. Picture empty space that turns into a solid crystal, citrine, under a strong enough force. That's the picture I use for folding: with enough force, very little becomes something of value. Hyperrelevance, which I explain below, is that force.

I owe you the line where my picture stops being physics. Nobody has grown a gemstone out of a vacuum, and I couldn't find a single experiment that claims to. The physics does give us two real results. In 2016 Roberto Mignani and his colleagues measured the faint light of a dead star whose magnetic field is around ten trillion gauss, and they argued that empty space near it was bending light the way a crystal does. Later reviewers called that evidence suggestive and short of proof, and the argument is still going. In July 2021 the STAR team at Brookhaven National Laboratory made more than 6,000 pairs of particles by smashing light into light, which is matter out of pure energy and still a long way from a gemstone.
And the citrine itself has a punchline. The Gemological Institute of America says natural citrine is rare, and that most of the citrine in the shops is amethyst that somebody heated. Gem-A, the British gemmology association, gives the recipe: bury the purple crystals in sand and hold them at 250 to 500 degrees Celsius for up to a few hours. So even my crystal was never made from nothing. Somebody took a thing that already existed and added force until it changed.
That's the part of the picture I keep. The void in my head was never empty, and neither is yours.

An idea starts as nothing and gets its shape from the detail you add. An idea starts as almost nothing: "Make a video about our product" is mist in a jar. Then you add detail: the physics of the machine, the history of the trade, the culture of the crew, the reader's memories, wants and fears. The more of that the world model holds, the better and deeper the content it can produce.
In plain words, the more you know about who a piece is for, the sharper the piece gets. That's what I mean by hyperrelevance. It starts from a decision someone has to make, sends out a probe such as an interview or a small release, and writes down what comes back with its date. Relevance means the piece fits the topic. Hyperrelevance means it fits one person on one day. A new hire on their first cold morning with a machine needs a different piece than the owner who's deciding whether to buy three more of them. The pieces in the cloud are the same. The person is the force that pulls them into a different shape.
You can count the detail in your own marketing. Take the last thing your company published. Count the details in it that are only true for the person it was written for. If a competitor could put their logo on it and change nothing, you published mist. Now add one detail that only your reader would recognise, like the word they use for the problem when they complain about it at lunch. Something in the piece has to move to make room. That movement is the fold starting.
So the force is detail, aimed at one person. Fine. But "apply force to a cloud" still sounds like something a wizard does. What does a fold look like when I can hold it in my hand on a Tuesday afternoon?
I build every fold as a fancy Mad Lib
Two comedy writers invented my favourite data structure in 1953. Leonard Stern was in his New York apartment, stuck on a script for The Honeymooners. He needed one adjective for the nose of Ralph Kramden's new boss, and he'd been staring at the typewriter for half an hour. His friend Roger Price walked in. Stern said he needed an adjective, and before he could say what for, Price said, "Clumsy and naked." The boss now had a clumsy nose, or if you prefer, a naked nose. They laughed, cancelled their day and spent it writing stories with key words left out. Stern tells the whole thing on the Mad Libs site, and it's as charming as origin stories get.
It took them five years to find the name, which they overheard at Sardi's when an actor wanted to ad-lib and his agent called that mad. No publisher wanted it, so they printed 14,000 copies themselves and stored them in Price's dining room for three months and 17 days. Then Steve Allen used one on television to introduce "our guest NOUN, Bob Hope", and the stores sold out that week. When sales passed one hundred million, Price told Stern that you can fool some of the people some of the time, "and that's enough."
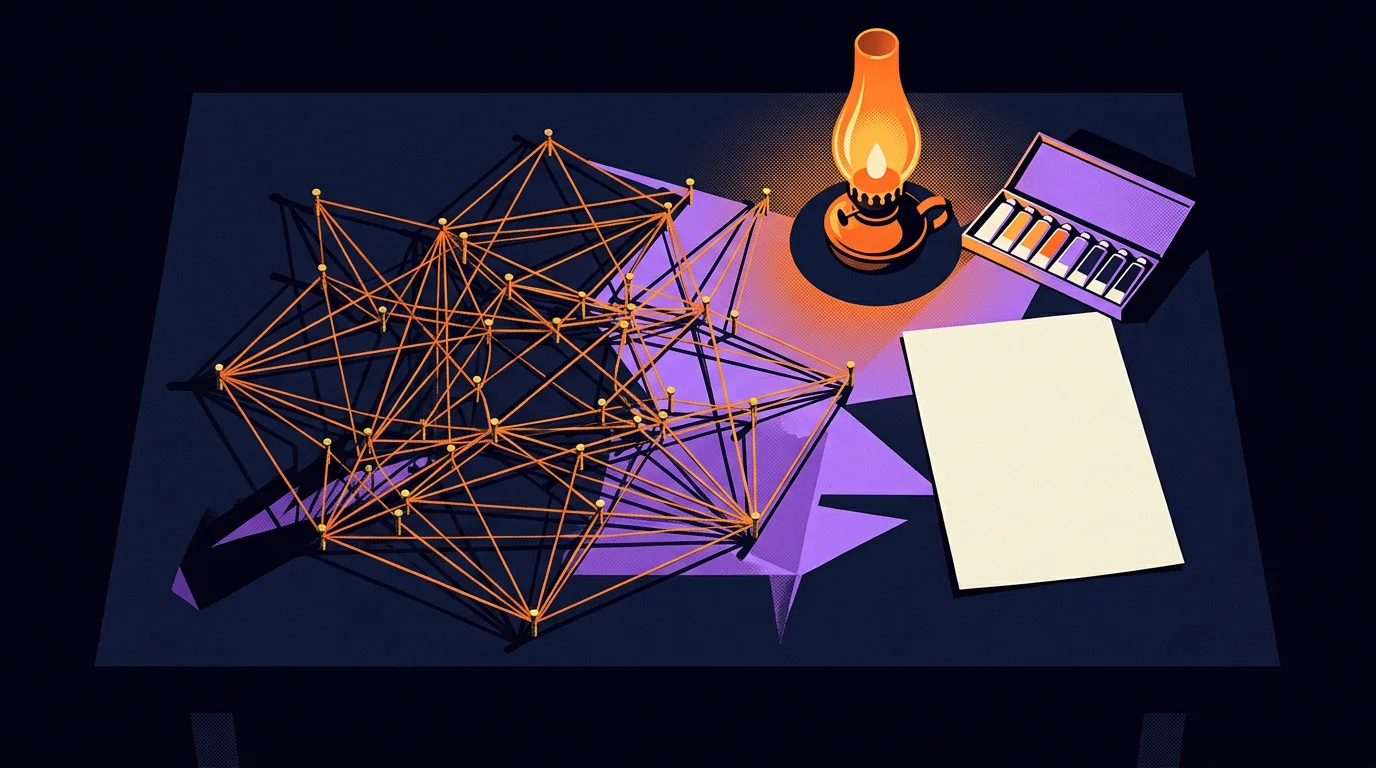
A Mad Lib prints the kind of word each blank needs. Look at what those two built. The story is fixed. The blanks are open. And every blank has a type printed under it: NOUN, ADJECTIVE, PLACE. The game is funny because you fill the blanks blind. A fold is the same page played the other way round. You fill every blank on purpose, with the piece from the cloud that fits that blank best for this reader. That's what makes it more than a word game: a blank can ask for a clip, a photo, a number, a customer's exact phrase or a tone of voice.
A small one looks like this. "(WHO IT'S FOR), you told us (THEIR WORD FOR THE PROBLEM) cost you (WHAT IT COST) last season. (PROOF) shows the fix. Your next step is (NEXT STEP)." That's five blanks. Fill them for a site foreman and you get one message. Fill them for the owner's accountant and you get a different one from the same sentence.
The tool we use for this is called Jinja. Armin Ronacher wrote it in the late 2000s, and his project's own FAQ explains the name: a jinja is a Japanese shrine, a temple, and "temple" sounds like "template". His work now sits under an enormous amount of software. Data teams write their queries in it. Hugging Face, the big public library of AI models, uses Jinja templates to format every conversation a model reads, and its engineers warned in 2023 that the wrong template quietly makes a model worse with no error to tell you. A pun now sits under a large share of the world's software.
Anything worth doing once, you're going to be doing many times. So build it as a template with typed blanks. The same templates write prompts, briefs and pages, and agents can research and fill most of the blanks themselves.

I grade every blank on its own. This is the habit I borrowed most directly from the protein people. AlphaFold doesn't hand a biologist one score for a whole protein. It colours every part of the shape by how sure it is, so a scientist can see in seconds which regions to trust. I want the same thing on a piece of content. The blank for "who this is for" might be solid. The blank for "proof" might be filled with a photo that almost shows the right thing. One score for the whole piece would hide exactly the blank I need an editor to look at.
Typed blanks catch real mistakes, too. The data company dbt Labs published a paper this year about adding type checks to their own Jinja templates, and the checker found 30 errors nobody knew were there. A Mad Lib that puts a VERB where a NOUN belongs is funny at a party and expensive in production.
I fix the template when a piece comes out wrong. When something comes out wrong, the fix goes into the template, not into each piece. By templatizing things, we can version control our templates and we can split test our templates. If a hundred pieces came off one template and they all open with the same limp first line, I've got one thing to repair. A team that writes each piece by hand has a hundred.
So a fold is a set of typed blanks, filled on purpose, with a grade on each one. Stern and Price got one funny story out of each page. How many things can I get out of one fold?
One fold opens into any format you ask for
A Japanese astrophysicist designed a fold that opens with one pull. Koryo Miura worked on a problem that sounds like origami homework and was rocket science. A satellite needs big flat solar panels, and a rocket has a small round nose. His answer, the Miura fold, creases a sheet into a grid of slanted parallelograms. NASA's Jet Propulsion Laboratory describes what makes it special: there's only one way to open or close it. Pull one corner and the whole sheet opens. In 1995 a solar panel folded that way opened in orbit on a Japanese satellite called the Space Flyer Unit. You can buy city maps folded like this today, and they're the only maps I've ever managed to close again.

Technicians spent a month folding a sunshield that opened in eight days. The James Webb Space Telescope has a sunshield about the size of a tennis court, roughly 21 metres by 14.5. The rocket's nose cone was about five metres wide. NASA's technicians spent a month folding five layers, each thinner than a hair, into zigzag stacks. In space it opened over eight days, from 28 December 2021 to 4 January 2022. Engineers counted 344 single points of failure on the telescope, and most of them were in that unfolding. Every one of them worked. I think about those technicians a lot. Nobody claps for the fold. Everybody claps for the photo of the galaxy.
That's the trade I'm asking you to see. A careful fold costs more up front than a search. It pays you back each time it opens.
It's the Mux decision in different clothes. Plain search is the general tool, and it does most jobs reasonably well. For a one-off question, search is plenty and a fold is a waste of an afternoon. I reach for a fold when the same material has to come out in five formats, for three kinds of reader, every month. There's a line, and the bill tells you when you've crossed it.
A radio network learned to file each story once and publish it everywhere. Daniel Jacobson ran the team at NPR that rebuilt its content system, and in 2009 he wrote up their rule as COPE: Create Once, Publish Everywhere. The idea was to keep the story separate from the way it's displayed. A reporter files one story, stored as clean labelled parts, and it flows to the website, the phone app, the member stations and whatever screen gets invented next year. Years later Jacobson was surprised people still passed the post around. They still do, because the rule still works.
Programmers have their own names for the two directions. Jeremy Gibbons at Oxford wrote a chapter in 2003 with the best title in computer science, "Origami programming". In his words, "unfolds generate data structures and folds consume them." A fold takes many pieces in and gives one shape back. An unfold takes one shape and grows many pieces out of it. Folding and unfolding are the two halves of the method in this article.
So one fold about that machine setting can open as a tall video for a phone, a wide cut for a training room, a five-card carousel, a spoken line for a voice agent or a paragraph in a proposal. The purpose and the evidence stay the same in all of them. Each format takes the blanks it has room for. And by media I mean far more than video and pictures. We'll get to how far that goes near the end.
I treat an empty blank as a request. Sometimes the cloud has nothing that fits. The carousel wants a photo of the setting on the screen in winter, and every photo we have was taken in July. A lazy system fills the blank with the July photo and hopes. A fold leaves the blank empty and writes a note: one winter photo needed. That note is worth money. It tells the crew exactly what to shoot on the next cold day, where the usual instruction is "get more footage", which is how you end up with 400 clips of the same thing from the same angle.
There's one thing a paper map has that my fold doesn't. A map of a city is still roughly right next year. Is a fold?
Every fold needs a date and a label for what's built
Today's shape isn't yesterday's shape. It's the gap I see in nearly every content system I'm shown. Somebody builds a nice map of the customer, frames it and never touches it again. Meanwhile the customer got a new boss, the product got a new screen and it started snowing.

Say I folded that machine lesson in July. By January the screen has had an update, the crew has two new people and the ground is frozen. The July fold still reads well. It's also wrong in three places, and nothing on the page tells you so.
The protein people hit this wall as well. A protein in your body wiggles, so the field has started showing one molecule as a family of shapes instead of a single frozen picture. I'd like the same for a fold. Stamp every fold with the day it was made, what it was made from and what it was for. Then when a piece stops working, I can ask a useful question: did the material change, did the reader change, or did I fold it badly? Without the date I'm just guessing with confidence, which is the most expensive kind of guessing.
A dated fold is also how I keep my own promises. When a client asks why a video said what it said in March, "the AI wrote it" is a terrible answer. I want to open the March fold and point at the page each line came from.
Part of what I've described runs today and part is still a drawing. You deserve to know which is which, because articles like this one love to blur it.
- I live on the first floor. The pieces are embedded, across text, pictures and clips. The neighbourhoods are computed. The templates are real, they're versioned and agents fill them. The video plays from Mux.
- I've framed the second floor. Typed blanks with a grade on each one work on single pieces that a person checks. Empty blanks turn into shot requests on paper, and a human still carries the note to the crew.
- I've only drawn the third floor in chalk. A fold that runs itself end to end, saves a dated copy every week and compares this week's shape with last week's is designed and not yet built. I have no numbers to show you for it, so I won't pretend to.

So data folding is an opportunity, not a finished product. The first floor is solid enough to stand on while we build the second. That's where it stood in November 2026.
It's the same lesson as the video bill. A junior builder will tell you all three floors are finished, because from the street you can't tell framing from chalk. Ask any builder which floor you're standing on.
Every fold so far has borrowed a reader I never described. Each chapter here has leaned on one phrase without paying for it. Fold the cloud "for a purpose". Aim the detail "at one person". Fill each blank with what fits "this reader". Which reader? What do they want, what are they afraid of and what do they call things? A fold that can't answer those questions is an organised pile.
The answer has a name, and I've been using it all along without explaining it. So how does a machine learn who it's folding for?
Every piece of content lands in somebody's world

Anna and Celina are the same dot to anyone outside Dallas
I grew up in a small town north of Dallas, and that sentence tells an outsider almost nothing. The last part folded everything to a purpose and then asked who the fold is for. A purpose comes from a place, so let me take you to one.
Look at the towns around Dallas. Each has its own culture. South Dallas isn't the same as North Dallas. Frisco isn't the same as Lewisville. Lewisville isn't the same as Anna, and Anna's damn sure not the same as Celina. If you grew up there, you nodded at every one of those, and you may be a little offended on behalf of one of them. If you didn't, I just read you six names off a road sign. None of these means anything to anybody who's outside of Dallas.

What the local has and the outsider lacks is a world model. A local carries a working model of the place in their head. It holds who lives where, what a Friday night looks like, which direction the money is moving and what you can joke about. An outsider carries a map. The map is accurate, and it can't tell you what anything means.
This idea is older than the computer, and the man who wrote it down died at 31. Kenneth Craik was a Scottish psychologist at Cambridge. In 1943 he published a short book called The Nature of Explanation. In its fifth chapter he suggested that a thinking creature carries what he called a "small-scale model" of the outside world in its head. With a model like that you can try a thing before you do it. His example was a bridge. You'd rather design it in your mind and know it'll carry the train than build ten bridges and count the ones that fall down. Craik died in a cycling accident in Cambridge on 7 May 1945, the day before the war in Europe ended. He never finished the theory, and people have been finishing it for him ever since. I think about his bridge a lot.
A world model also has a date stamped on it, and mine was out of date. I went and checked my own example. The Celina in my head is a small town. The U.S. Census Bureau counted 6,028 people there in 2010 and 16,739 in 2020. Its estimate for July 2025 is 64,427. Celina was the fastest-growing city in the country that year among places with at least 20,000 people, up 24.6 percent in twelve months. Anna was fifth on the same list. Frisco, the big one down the road, grew 0.8 percent. So the kid from north of Dallas is now partly an outsider to his own example. My model was right on the day I built it, and nobody told it the town had grown more than ten times over. Hold on to that. A world model is a thing you keep, and a thing you keep has to be kept up.

Geography was only the easy example of a world model. A town is one world model. Culture, history and religion each work the same way. A sales chat room has one. A boardroom comparing term sheets has one. The crew on a job site has one, and the office upstairs has a different one. Every single environment a piece of content could land in is itself its own world model.
I think skipping this step is where slop comes from. Nobody thinks about it when making an ad or a carousel, yet every piece, from a short post to a long series, needs a world model.
At the working level there's nothing mystical about a world model. The world model is just a knowledge base. Mine is the same knowledge graph I described in Part 2, spread across the same handful of tools. What changes the output is how much you put in. That's the citrine from Part 4 again, and detail is the force that makes the crystal.
That leaves a practical problem. Nobody can follow the instruction "put in more detail". Detail about what? What's a world made of?
An entity is still itself after you smash every fact on it
I keep saying "entities" where a normal person would say "people". I'm doing it on purpose. I look at everything through a framework called ECS, which stands for entity component system. It gives me three plain words for anything I'll ever need to model.
An entity is a thing with an identity. It could be a town, a customer, a manager, a video or a brand's voice. A component is a piece of data that describes the entity, like its population, its budget, its reading level or the thing it's afraid of. A system is a rule that acts on components and changes them. So if everything is an entity, I can just ask myself two questions. What data components would be useful to define this thing? And what systems would be applied to adjust and change those components?
Two details make this more useful than it sounds. The first is that the systems might have nothing to do with the entity. A tax rule doesn't know you personally. It looks for anybody carrying an income. The second is that the entity is still its own entity, whatever happens to its components. Celina just proved that. Every number on it changed, and it's still Celina.
Game makers worked this out when their monsters stopped fitting into a family tree. The clearest account is a 2002 talk. In 2002 Scott Bilas of Gas Powered Games stood up at the Game Developers Conference and described the object system behind Dungeon Siege. His slides say the game had more than 7,300 unique kinds of object and more than 100,000 objects placed across its two maps. There were trees, monsters, levers, doors, potions and arrows. The usual way to organise them is a family tree, where a sword is a type of weapon and a weapon is a type of item. Then a designer wants a door that fights back, the tree has no branch for it, and an engineer has to rebuild the tree. One of his slides just says "Engineers are slow". His goal was a game where changing an object needed no engineer at all. His answer was a box of parts. Each part does one job, and a plain data file says which parts make up which object.
Who got there first is still argued about. In June 2026 Casey Muratori published a long interview with Marc LeBlanc that traces an earlier version back through Looking Glass Studios to Thief: The Dark Project. Then in 2007 Adam Martin wrote the blog series that gave most of us the vocabulary. His example was a bicycle. It's made of metal, a human can ride it, it's transportation, it can be bought and sold, and it's a popular birthday present. Those are five separate facts about one thing, and no family tree holds them all. The history is still argued over, and the bicycle is the clearest picture of the idea.
I borrowed the box of parts and pointed it at people. A reader is an entity. So is a voice. So is a town, a competitor, a product or a joke. Every entity should carry at least a couple dozen properties.
For an owner, the payoff is practical. "Understand your customer" is a poster on a wall, and ECS turns it into a list with blanks. The persona is the entity. Their reading level, their biggest worry, what they've already tried and who they trust are components. "Write the headline for this person" is a system, and a system can only run when the components it needs are filled in. Empty components are how the machine wrote you slop. It reached for the facts and found nothing there.
That's a couple dozen facts for every entity, though. Then you multiply by every kind of customer, every competitor and every town. Who has the time to fill all of that in?
A world model is a form with 15 to 45 questions on it
From a functional level, a world model is really just a form. You ask a bunch of questions about whatever you're existing in and whatever you're doing. I know that's a letdown after two chapters of towns and monsters. The form I use has three sections, and they come from the first phase of a framework I call people, product, process, or PPP. PPP runs nine stages in three phases. The people phase comes first, and its three stages are problem, future and transformation. The problem is the pain as the person lives it. The future is where they want to be instead. The transformation is the bridge, meaning the specific changes it takes to get from one to the other. The product phase and the process phase come after it. This form asks the people-phase questions.

Section one asks what hurts. Whatever the entity is, it's facing a problem. It could be a manager in an office building who has to balance a budget. It could be an executive who has to raise a shit ton of capital. Maybe it's a janitor who needs to figure out how to get rid of some kind of a stain. Whoever it is, there's a problem, because if there isn't, what are we talking about? And it's a problem because it has a consequence. Maybe the pain is physical. Maybe it's financial. Maybe it's time. Maybe there's a risk they want to avoid. Maybe there's nothing at all, and they just don't like it, as some might say. Every one of those counts. There's an undesired state, and the form writes it down.
Section two asks what they want, and this is the hard one. What's the positive? What's the goal, the thing you're moving towards, wishing towards, hoping towards? If you could wave a magic wand and it could happen, what would it be? People stall here, and I think I know why. When you're facing a problem, what you want usually sits in a different voice register, a different semantic sector, than what you're experiencing. Pain talks in one vocabulary and hope talks in another. Separating your awareness from your experience long enough to answer isn't a common trait among entities, and especially among humans. An owner who can recite the bill to the cent often can't tell me what a good month would look like. So the form asks patiently, in several ways.
Section three explores the solutions before it sketches the transformation. Our responsibility is to explore a whole solution space. Notice I didn't say come up with a solution. What are the solutions now? What are the trade-offs between them? What makes sense for our situation? Only then do we sketch the transformation journey from the undesired state to the wanted one. Part 1 was this section in miniature. I could keep the video on the general platform, move it to a specialist, or wait and measure. Each option had trade-offs, and the right answer changed with the size of the team.
Three short sections come to 15 to 45 questions. What problems are we facing? Boom, that's a form, 5 to 15 questions. What do we actually want? Bam, 5 to 15 more. The bridge, meaning the options, their trade-offs and the changes it takes, adds another 5 to 15. So we're looking at a 15 to 45 question form for the problem, the future and the transformation. That's not egregious, and it's not a bad place to start. Mind you, these aren't random questions. They're simple questions and accessible questions, and from the outside looking in they may even seem innocuous.
Arguably, nothing is innocuous to the mind that's actually being used. "What happens if you do nothing?" sounds like small talk. Answer it straight and you've handed me your deadline, your fear and your budget in one sentence. That's why a short form gets so far. Each answer is a component, and each one makes the next piece of content a little less generic.
A small number going a long way has good precedent. In 1993 Abbie Griffin and John Hauser published "The Voice of the Customer" in Marketing Science. They counted how many customer needs each extra one-hour interview turned up. One interview surfaced about a third of them, and 20 to 30 interviews surfaced an estimated 90 to 95 percent. Their study counted interviews and mine counts questions, so I'm borrowing the shape of their curve and none of their numbers. The shape says the early answers do most of the work.
How far does it reach? I've run the same three sections on a company, a campaign, a fictional character and a town. As far as I can tell, it will define a world model for pretty much anything in this universe and any universe you can conceive of from inside this one. That's not all universes, by the way. I try to stay humble.
So the form gives me the problem, the want and the road between them. It tells me what's true about the situation. It hasn't told me why the person on the other end responds the way they do. That's the job of a second framework of mine, PST, for problem, story, transformation. PST's problem is the loop a person keeps repeating: a pain, a fear, the avoidance that follows, a bad result and the shame after it. Its story is the set of beliefs that keeps that loop running. Its transformation is the way out, and it starts with the courage to look at the truth. PPP tells me what to build for someone, and PST tells me who I'm talking to. Neither one tells me how to say it. What tells me about the reader?
One true thing needs a different telling for each reader
I start with how they read, because first grade, fifth grade and college are three different audiences. Do we speak at a first-grade reading level, a fifth-grade reading level or a collegiate reading level? They're not the same, and they have a different impact. This one has good numbers behind it. Rudolf Flesch published his reading-ease formula in 1948, and it runs on two things anybody can count, the length of the sentences and the syllables in the words. In 1975 a team led by J. Peter Kincaid recalculated it for the U.S. Navy so the score would come out as a school grade. They tested 531 enlisted sailors on passages from their own training manuals. That's the Flesch-Kincaid grade level sitting inside your word processor today.
It matters because of the people on the other end. In 2020 Gallup analysed the federal PIAAC survey for the Barbara Bush Foundation and reported that 54 percent of U.S. adults, about 130 million people, read below the equivalent of a sixth-grade level. One fair warning goes with that figure. A grade score counts syllables, and it can't tell whether your reader knows the word. Reading level is one dial, and there are more dials.

Then I ask what they value, and for that I use Spiral Dynamics. It helps me get a nuanced understanding of behaviors and motivations. The psychologist Clare Graves worked for decades at Union College on a theory that adults move through levels of existence, each with its own idea of a good life. He published an eight-level version in The Futurist in 1974. His students Don Beck and Christopher Cowan gave the levels colours and a name in their 1996 book Spiral Dynamics. In my plain words, the eight are staying alive, belonging to the tribe, power, order and duty, achievement, community and fairness, seeing the whole system, and caring for the whole planet.
There's a ninth level, called coral. I leave it out. Cowan's own introduction to the model calls it "too soon to say".
With the eight layers I ask two things. What proportion of the population is in each of these? And most importantly, how much influence do the people in each layer have? Put those together and you get something of an optimization map for whatever campaign you're designing, whatever content you're creating, whatever joke you're telling. Be careful with the numbers passed around online, though. Beck and Cowan's own book calls its percentages "only guesswork". So I use it as a lens for asking better questions. I don't use it as a measurement, and I'd never stamp a colour on a real person.
Then I ask what they believe about themselves. What programs does the person have? What belief structures, what patterns, what influences in their life make them think the way they think and feel the way they feel? I like to look at it from both the conscious and the subconscious side. Let's say you're helping to teach people how to code. Most people are intimidated by it because they consider themselves "non-technical." That's a belief, and it can be worked with. What other belief structures are typically tied to that? What keeps those belief structures where they are, what are they held together by, and how does that tie in to them personally?
Albert Bandura gave those props names in a 1977 paper in Psychological Review. He said a person's belief that they can do a thing comes from four sources. They've done it before, they've watched somebody like them do it, somebody credible told them they could, and their body feels steady while they try. Read "I'm not technical" against that list. It usually means no wins yet, nobody like me doing it, a teacher who sighed, and a stomach that drops when the screen fills with code. Now I know what to write. I'd open with one small win in the first minute and a story about somebody like them. That's what it means to connect with a person where they are. Other models, such as Ken Wilber's integral theory, which maps any situation from the inside and the outside of both the person and the group, can be used the same way: as lenses for better questions.
Describing the color red to a blind guy is very challenging. All three of those lenses run into the same wall, which is that I can't hand anybody my own experience. The philosopher Frank Jackson built a famous thought experiment on that problem in 1982. Mary is a scientist who knows every physical fact about colour and has lived her whole life in a black-and-white room. Does she learn something on the day she walks out and sees a tomato? Jackson said yes. Years later he changed his own mind, which I respect enormously. I bring it up because every writer is standing where Mary's teacher stands. My own wiring makes some ordinary things hard and some unusual things easy. Technology can support you in doing things you're not able to do on your own, and here the model of the reader is that technology. It's how something inside my head gets to land inside yours.
So now I have the situation from the form and the reader from three lenses. That adds up to a huge cloud of true things I could say, and I get to send one. How do I pick?
You send one piece out of everything true
Sending one piece rules out every other version. Physics has a name for that pick. A world model is a broad cloud of things you could say, and sending one piece collapses it, the way a measurement collapses a wave function.
Before the collapse there's a whole bunch of different probabilities. Then, boom, there's reality. You can't change it and you can't go back. Once it happens, the other possibilities are gone.
Content works the same way. Before I publish, a piece is every version it could be. It's the first-grade one and the college one, the one that opens on the bill and the one that opens on the ocean. The world model sets the odds. Then I send one, and that's the piece. You can't un-read it. I can publish a better version tomorrow, and you'll still arrive having read the first.
None of this is new. Nature has been settling possibilities into one outcome for billions of years.
Nothing quantum happens when I pick a headline. In the textbook account a measurement gives one outcome, and the odds come from a rule Max Born worked out in 1926, which won him a Nobel Prize in 1954. John von Neumann wrote the collapse into the formal theory in 1932. Then in 1957 Hugh Everett proposed dropping the collapse altogether, and physicists have argued ever since about whether anything collapses at all. My picture stops being physics right there. I'm borrowing the shape of the idea, which is many possibilities, some constraints and one result you can't undo. I'm in decent company. In 2016 a programmer named Maxim Gumin published an algorithm called WaveFunctionCollapse. It builds pictures and maps by letting every tile start as "could be anything" and then settling the tiles one at a time, with each choice narrowing its neighbours. His own notes say it doesn't do the actual quantum mechanics and was only inspired by it. Oskar Stålberg took the idea into the islands of Bad North and the towns of Townscaper. Those are whole worlds, generated by collapsing possibilities under rules. Both of them showed that the borrowed version works.
I choose the one piece by smashing two absurd things together. A line on a cloud bill and a swimmer out of sight of land sit far apart. A sentence that joins them makes the reader feel the risk in the bill.
Arthur Koestler named that move in 1964, in The Act of Creation. He called it bisociation. It means seeing one idea in two frames that normally have nothing to do with each other, and he argued it's the engine under jokes, discoveries and art alike. I'm glad he wrote it down, because it meant I could stop calling it "the thing I do". The measurements are catching up with him. In 2025 William Orwig, Simone Luchini, Roger Beaty and Daniel Schacter, working at Harvard and Penn State, published a study in The Journal of Creative Behavior. They found that people rate ideas as more creative the further apart the two concepts sit, up to a threshold. Past that threshold, more distance stops helping. So there's a sweet spot. The clustering and neighbourhood tools from Part 3 earn their keep here. They find two things that are far apart on the map and can still be reached in one sentence.
The leap only lands if both ends are solid. Each end has to come from real expertise, such as a textbook or the people a community treats as its experts. Whoever a community has decided are its smartest people count too, because community sentiment is one more way to define what expertise could be. Then you smash the two together in a way that's accessible to both sides. That's where the reading levels and the eight layers come back in.

That's how shameless slop turns into something of genuine value. People call it AI dialect, or AI slop. I'd describe it as content with no world behind it, aimed at nobody. Give it a world, a reader and a real choice, and you get something that connects. It moves people and motivates them, and it makes them appreciate the time they invested in it.
Now look at the bill for that. One piece needed a world model, a couple dozen facts for every entity in it, a form with 15 to 45 answers, three lenses on the reader, a search across the map for the right leap, and a choice nobody can take back. I just described the work behind a single paragraph. A business needs it for every post, every email and every video, every week. No one person keeps that up. So who does all of it, for every piece, every time?
An AI agent needs a whole office around it to finish a job
Building a world model and choosing the one piece is a miserable job to do by hand. Somebody has to ask the questions and look things up. Somebody has to write forty options, throw out thirty-eight, check the facts and send the survivor to a person who can say yes. So who does all that? I do have an answer, and it lives in an office building.

Software around an AI model has to do what a company's back office does
Call it a harness and an AI agent sounds like something you download. In AI engineering, the harness is the software wrapped around a model so the model can do work. Vivek Trivedy at LangChain wrote the cleanest definition I've read, in March 2026: "If you're not the model, you're the harness." He means the prompts, the tools, the memory and the checks. I'd push it further: a harness is an operating system, closer to the systems that run a company than to an app. Mine is called Superharness. It holds the rules my agents read first, the tickets they work from, the checks that run before anything ships and the records they leave behind.
Think about what it took to open your own doors. You had to have a CRM and some kind of payroll software before the first invoice went out. A calendar, email and probably a scheduler came next, with a phone system and something for your domains close behind. I count a couple dozen things any business has to deal with before it sells anything. Okta counts the apps its customers connect to their logins, and Part 2 gave its figure for small companies. Its 2025 report put the average across all of its customers at 101, the first time that number passed a hundred. No owner wants another subscription on that list.
I plan by imagining the right person for the job. Let's call this person the Mega Mastermind. They hold a PhD in hypnotherapy and a PhD in organizational psychology. They found a paper called Flash Organizations by a researcher named Melissa Valentine and then learned everything they could from her other papers. They applied it, scaled their own agency and a bunch of other agencies, and made a great deal of money for customers across pretty much every conceivable industry. Now hand that person a raw AI model and ask what they'd build around it.
They wouldn't stop at a script. They'd want a log of what is happening. A knowledge base would come next, to store all the information that's useful and important. The records would have to be available somewhere, with analytics on top. You'd hear about notifications and reporting, and more likely than not some kind of optimization. Then they'd ask for training material, technical support and customer service. After that they'd ask for operations, fulfillment, sales, marketing, graphic design and video editing. That's a whole company's worth of departments.
Engineers at OpenAI started with only a model and ended up building the same back office. Ryan Lopopolo's team at OpenAI spent five months building an internal product in which agents wrote every line of the code. Three engineers started it. The repository grew to about a million lines across roughly 1,500 merged changes, and the team later grew to seven. The surprise was how slow the start was. The model was capable from day one. The environment around it was underspecified, so the engineers' main job became building that environment. They learned that a decision made in a chat thread was invisible to the agent, the same way it would be invisible to a new hire three months later. They ended up handing the agent a short map of the repository where they had once been tempted to hand it a thousand-page manual.
Those are office problems. A new hire needs a desk, a manual, a boss and somewhere to file the work. An agent needs the same four things, and it will let you know by failing politely until it gets them.
Mel Conway wrote the reason down in 1968, in a trade magazine called Datamation. Any organization that designs a system ends up with a design shaped like its own lines of communication. Fred Brooks later named that Conway's law. Alan MacCormack, John Rusnak and Carliss Baldwin tested it at Harvard on pairs of software products that did the same job. In every pair, the loosely organized group had built the more modular product, by as much as a factor of six on their measure. If my system is going to copy an organization anyway, I'd rather design that organization on purpose.

So the harness has to carry a whole company's worth of plumbing. That sounds like the couple dozen subscriptions all over again, and no business wants more of those. My way out was to give new jobs to the building I already had. So which room does what?
I gave each tool I already paid for one room and one job
I assigned departments to software I already ran. Each tool I already paid for got one job. One is the main office, where tasks and clients live. One is the library, for documents. One is the data room, for records. One is where every agent task starts as a ticket that says what was asked and how it will be checked.
Excalidraw is the drafting table. We use it to map things out, so we have a core language for how we think about a design. The agents can think in it too, and they can show us what their workflow looks like before anybody builds it. Mux became the screening room the week this article started, when the video bill in Part 1 sent the review films and the video library there.
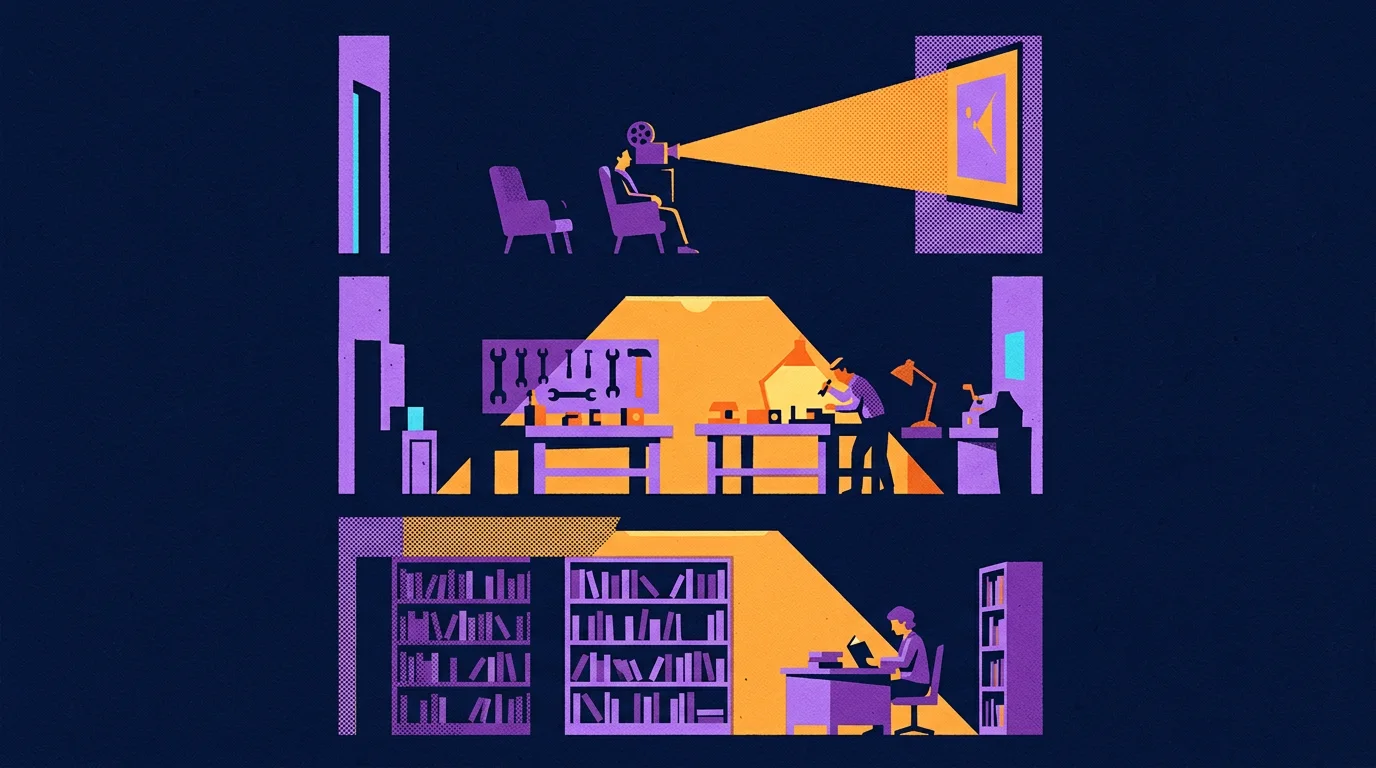
Each tool hands the next one a link, and a heavy file stays in one place. I think of the link as a ticket and the file as a crate. A film is a heavy crate. It sits in Mux. The record in Convex holds a short ID that points at it, with the tags and the comments beside it. The Linear issue points at the Notion brief the editor should follow. The ClickUp row points at the Linear issue. Nobody carries the film upstairs. The video bill taught the same split, where the general platform kept the record and the specialist kept the stream. Anthropic's engineers describe the same habit in their research system. Their worker agents save what they made in an outside store and hand the lead agent a lightweight reference. They found that copying big outputs through a conversation loses information and costs more.
Copies are how an office ends up with four versions of a film and an argument about which one the client saw. A ticket can be wrong, and you fix it by fixing one line.
Here's one job walking the building. A request for a long article becomes a Linear issue with its finish line written before any work starts. Each research and writing assignment gets its own row in the ClickUp queue, and each row points back at that issue. The writers pull my earlier articles and notes from the library. If a ticket points at a summary when the job needed the original, the work comes back wrong however good the worker is. A ticket is only as good as the crate it points at.
Everything I've named fits on two lists. The technology stack is the tools. The concept stack is the ways of deciding what to do with them: the nine rungs and the five steps you'll meet in the next chapter, the PPP questions and the PST lens from Part 5, and the entity, component and system lens I use on everything. I'll write about each of them in more depth.
Knowing that these rooms exist is the easy part. A room with a name on the door still needs somebody in it who knows the job. So what does the person at each desk actually get handed?
Every task I hand an agent carries nine levels of purpose above it
An office is a team, and I can turn most of what that team does into workflows. A team has roles, roles have tasks and projects, and those break down into actions that fall into a few categories. Each category can become a workflow, and an agent can run a workflow.
Think about how a person gets a role. A person earns one through school, tests and years inside a field. That whole process earns you a position, and the position is what requires you to take certain actions. Whether or not you get to practice those actions decides whether you get good at them.
The senior from Part 1 knew not to serve video out of a general database because he'd already been billed for it, and the junior hadn't been yet. An agent shows up every morning as the best-read junior on earth. It has read everything, and it has done nothing at your company. So the role has to arrive written down, with the lessons a senior would carry in their head.
Here's a written role for the smallest job in the building. The playback tester's card names the exact page to open and the record that has to survive the change. It says which single thing to observe and where the result goes. It ends with a door to knock on if the stream turns out to belong to somebody else's job. The whole card is five lines. Leave one out and the agent fills the gap with a confident guess, which is the oldest move a junior has.
Every piece of work carries the full chain from mission down to event. I picture it as a ladder. Every single workflow is just an action. Every action is there to complete a task. Tasks are organized as projects. Projects are used to complete initiatives. Initiatives are designed to achieve a mission. Even the person who designed the ladder can drop a rung when saying it from memory. That's the whole argument for writing it on the ticket.
There are nine rungs: Mission, Objective, Initiative, Project, Task, Action, Decision, Data and Event. Here's the video move from Part 1 on the ladder. The mission is a media platform a Construction and Engineering industry client can afford as its library grows. An objective has to be checkable, so ours was every review player streaming from the video specialist. That objective sits inside an initiative, the playback migration, and the project within it was the video library. One player is a task. Opening that player's page and watching where the stream comes from is an action. A reviewer then accepts or rejects what they saw, and that's the decision. What they looked at was the stream's ID and the address that served it, which is the data. One real play in a browser is the event.

A worker who gets only the task will do the task. A worker who gets the ladder can make a sensible call when the task turns out to be slightly wrong, because the purpose is written right above it. I'd describe that as the difference between a junior who follows orders and a senior who notices the order is about to cost you money.
Five steps move every job, and the first step is written in Linear before work starts. The five are scope, plan, strategy, action, complete. Scope comes first, and scope is defined in a Linear issue. It carries the operational hierarchy you just read, the PPP and PST questions, and a variety of other standards. That makes it to where an agent, or a person, can rely upon what's there. Plan picks a route through what already exists. Strategy decides how the uncertain calls get made and who can accept the result. Action is the work. Complete compares what happened with what was promised and feeds the difference into the next scope.
I can draw all of this on a whiteboard before lunch. A drawing doesn't do anything at three in the morning when step four fails. So what makes the drawing run?
Five plain parts make a drawn workflow run and recover from a failure
LangGraph draws the route a job follows. I use LangGraph to describe a workflow as a graph, which means named steps, the state they share and the rules for which step comes next. I use it because it gives people and agents a shared language for memory, state and checkpoints. And because the graph is code, it can be tested, run and scaled. LangGraph's own documentation says a checkpointer saves a snapshot of the state at every step, so a run that fails can restart from the last step that succeeded.
The second part is the contract. Everything that moves between steps is defined as a data contract built through Pydantic, the validation library Samuel Colvin released in 2017. A contract says which fields a record must have and what shape each one takes. Compare a message that says "the film's ready" with a record that carries the film's ID, a recognized status and the evidence for it. The next worker can reject the second one the moment a field is missing. It means we can rely upon the details we put in our data model.
Inngest keeps a logbook of finished steps, and it's the part I'd fight for. A workflow is only worth writing down if it survives a failure. Inngest's documentation describes the job in plain terms: it saves each completed step, retries the step that failed and resumes after a wait without redoing the finished work. Our PDF job is built that way. It prepares the job, extracts and chunks the text, enriches the chunks, then embeds and stores them. If enrichment dies, extraction doesn't run twice.
It also changes how a team works, because recovery is built in instead of improvised. Its docs carry a warning worth knowing. A saved step doesn't guarantee an outside action happens exactly once. If a payment provider takes your request and the reply gets lost, the retry can charge the card again unless you gave the request a key that marks it as the same one. A tool can save your progress. You still have to think about what the other side already did.

The fourth part is the stencil. Jinja, the template engine from Part 4, writes the briefs in the office, so every job an agent receives is rendered from a versioned template with the blanks filled from the ticket. When a brief comes out wrong, the fix goes into the template, the way Part 4 described.
PydanticAI seats a model at each step with a typed job to return. It's the fifth part, and Colvin's team released it in December 2024. We define an agent as a function, with its instructions, its tools and the type of thing it must return. Each function sits inside one step of the graph. The node holds the state, and the state is Pydantic objects modeled on the same entities, components and systems as the world model from Part 5.
That shared language is the quiet payoff. The office and the world model overlap. Define one world well, and most of the next one is already built.
I owe you the state of the wiring. Some of this runs as code today, like the PDF job, the rendered briefs and several graphs in the client's app. Other routes are still followed by agents and people reading a written plan. I haven't proved that every node in my office runs on all five parts, and I won't pretend I have.
So a worker sits at a station with a typed job in front of it. Which model gets that seat, and what am I paying it to be good at?
I pay cheap models for forty options and a smart model for one decision
I run a queue of real jobs on a subscription I already pay for. Two more tools make that possible, and they're where the models sit. Claude Code is the user-friendly environment. It's where I talk through what I want with a lead agent. T3 Code is where the work runs. T3 Code is an open-source control panel for coding agents, built by Theo Browne's team. In T3 we define our different profiles, organize our execution and reach each provider's command-line tool. The same panel can drive Claude, Codex, Gemini and Grok. Its makers say it doesn't resell tokens and that it drives the agents you're already signed in to. For me that means no second bill for the same models.
Cheap models do the wide work and smart models do the judging. You have to use cheap models for the parallelization and the tournament-style things, and you want to use smart models for the evaluation. There are many models between the cheapest and the smartest, so a lead model can direct a team of cheaper ones, with every assignment written down.
When I don't know what the best headline is, I need forty attempts from forty angles, and thirty-eight of them are going in the bin. Paying top price for every one of those is paying a surgeon to hand out flyers. Choosing the winner is different. A wrong pick there sends the whole piece out with the wrong promise on its forehead.
The seats in between follow the same logic. Design and judgement go to the strongest model. Jobs with a clear start and end go to a capable mid-priced one. Bulk sorting and tagging go to the cheapest that does it well. I assign by role, because the models change every few months and the roles stay.
Three studies measured cheap workers under a smart lead, and the results cut both ways. In June 2025, Anthropic's engineers wrote up their research system. A lead agent on their strongest model directed helper agents on a cheaper one, and that team beat the strong model working alone by 90.2% on their internal research test. They published the bill beside the win. A multi-agent run used about fifteen times the tokens of a normal chat. The price has moved since then. In July 2026 Anthropic's developer team reported a Fable 5 lead with Sonnet 5 workers on a hard web-research benchmark. That pairing kept 96% of the lead model's solo score at 46% of the price. Their documentation carries the catch, which is that on smaller tasks the lead model working alone came out cheaper. Then Google Research ran the cold shower in January 2026. On a finance task that splits cleanly into parallel pieces, a coordinated team improved on a single agent by about 81%. On a planning task where each step depends on the last, every team they tried did worse, by 39% to 70%. They also found that independent agents with nobody checking them amplified errors about 17 times, and a central coordinator cut that to about 4. Yubin Kim and Xin Liu led the study.
So breadth helps when the work really is wide, and the judge is the part you can't skip. I pick the seat by asking what a wrong answer costs. A duplicate tag costs a minute. The wrong first line costs the reader.
All of this leans on one big assumption. I'm assuming written roles and clean handoffs can carry hard work between workers who share no history. My agents never meet. They don't remember last week. Has anybody tested that idea on human beings?
Ninety-three strangers shipped three products because their roles were written down
Melissa Valentine's team tested written roles on 93 strangers in 2017. She's the researcher my imaginary Mastermind studied. That year she, Daniela Retelny, Alexandra To, Negar Rahmati, Tulsee Doshi and Michael Bernstein published Flash Organizations at the CHI conference, where it won a Best Paper award. They took three leaders with open-ended goals. One was a medical resident who wanted an app for ambulance crews to send patient details ahead to the hospital. One was a team making a storytelling card game. One was an employee at a large company who needed a workshop-planning portal.
Their software, called Foundry, hired freelancers from an online labor market into roles, and it filled a role in about fourteen minutes on average. Across the three organizations, 93 people who had never worked together completed 639 tasks in 3,261 hours of work. They wrote about 52,000 lines of code and finished all three projects inside six weeks. Outside experts rated the results acceptable. The trick was borrowed from film crews and disaster response teams. A boom operator and a grip can work together on day one because the roles already say who does what. The workers coordinated through what they knew about the roles, since they knew nothing about each other. That's my office in one sentence, and they wrote it eight years before I needed it.
The film crew half of that comes from Beth Bechky, who studied movie sets for a 2006 paper called Gaffers, Gofers, and Grips. She found that a crew of near strangers teaches itself the roles on the spot, through loud thanks, polite corrections and jokes about the job. The disaster half comes from Gregory Bigley and Karlene Roberts, who studied fire crews in 2001. On a fire, the captain of the first unit to arrive becomes commander of the incident, whoever that captain happens to be.
Written roles also cut patient time in a hospital emergency department by 40%. Two years earlier, Valentine and Amy Edmondson studied a city hospital that redesigned its emergency department. Before the change, any free nurse worked with any free doctor, and nobody knew who else was on a patient. The redesign created four pods. Each pod was a fixed set of roles with shared responsibility for its own line of patients, and the people filling those roles changed every few hours. Patient time through the department improved by 40%. The authors add a caveat. That hospital was behind its peers before the change, and other hospitals that tried pods got less out of them.
A pod is a room with roles in it. Everything in my office is some version of that sentence.
A workflow has to stay open to change while the work is running. Retelny, Bernstein and Valentine followed up with a paper called No Workflow Can Ever Be Enough. They watched 22 workers on six teams follow fixed workflows through complex web projects. The workflows helped people coordinate, and they also stopped people from adapting when the work surprised them. The flash organizations had an answer built in. Anybody could propose a change to a role, a team or a task, and somebody above them in the hierarchy approved it. Across the three organizations that happened 566 times, about four times on a typical day in each.
That's the lesson I had to learn the expensive way with agents. A workflow that nobody can amend will march a wrong assumption all the way to the customer. So someone must always be allowed to change the plan, and anyone who finds a problem they can't fix must be able to say so where the person in charge will see it.
The lesson from that research is simple: organise agents the way a good manager organises people.
So the office is built, from the named rooms down to the person holding the chalk. You'd be right to ask what the building is for. If I put a world model in the front door, what comes out of the loading dock, and what's it worth?
A content factory is a system built to outlast its builder

Part 6 ended in an office. It had rooms, it had roles, and it had workflows that agents can run. An office that makes the same kinds of things over and over is a factory. This part is about what the factory makes, how the good versions get picked, who pays for it, and what happens to the whole thing on the day I'm sick. Then we walk back to the bill where we started.
Every piece of work has to say what it's for
Picture a price sliding out of a column on a bill while a smaller price drops into its place. When the new number lands, it jiggles a little. Somebody decided on that jiggle. I want to know what they decided it was for.
I ask the same question of a jiggle and of an eight-figure season. Everything I make has to answer one question: what is it for? If the jiggle keeps your eye on the row while the number changes, it has a job. If it's there because the software has a jiggle button, it goes.

A value needs three to five ways to get across. The point of a piece is its value, and usually its headline. Three to five sections carry it, and each section breaks down the same way. One way of landing a point asks the reader to take your word for it. Nine ways is a list nobody holds in their head. Three to five is where I've found a point gets tested from enough sides to stick.
You've been reading an article built this way. The whole document has one core: start broad, split a job out when the need and the gain are real, and build the system that tells you where the line is. That core lands three ways: the bill in Part 1, the vector store I want and don't need in Part 2, and the office in Part 6. The article runs to seven parts because the four in between build what those three need, and the count of ways is still three. Chapters hang off the parts, and the bold sentences hang off the chapters. I can point at any paragraph and tell you which bone it hangs from.
I can't say what a piece is for until I know who it's for. When I'm bootstrapping anything, I start from how to generate immediate value for whoever the audience is. That means I have to understand who they are, what they want, what they're going through, and how I can serve them. Without those answers, good copy has nothing to carry. So I take the top five avatars in the target market. I look at the main competition and at the closest associates. I look at the parallel businesses that sit right alongside and the perpendicular ones that cross the same customer from another direction. Then I do the thing most marketers skip. I sit at the table and listen to how people talk and what they care about before I go out there and push a message.
Doing all this for every piece would be cruel to ask of people. Once I know the value and the parts, each part has to be expert, master tier. That means being aware of the best that's around me. I find the best, compare them, and work out what they're doing well and what others are doing badly. Then I figure out how to skip what's done badly and double down on what I do well. Asking people to hold that standard on every detail of every piece would wear them out. Agents can hold it without tiring.
Knowing what a headline is for still doesn't write the headline, though. Agents can know the purpose cold and hand back a line with no life in it. So how do you get from the purpose to the good one?
Our good headlines only showed up after dozens of versions competed
On a Monday at The Onion, about eight writers sit in a room and pitch jokes. Cole Bolton, who was the editor at the time, told an interviewer in March 2014 that the room alone brings 300 to 400 headlines, and contributors push the day to 700 or 800. "So I'm guessing we probably go through a thousand headlines a week," he said. Three years later two Onion writers, Louisa Kellogg and Jen Jackson, told a room of Northwestern students the count was about 1,500 a week, and that roughly 2 percent become articles. The funniest newsroom in America gets there by writing a thousand lines and throwing nearly all of them away. They said so in public, and most people who are good at something hide the pile.
I only got good headlines by making the versions fight. Humour works the same way. A round starts with several agents, taking on different personas, different perspectives, different requirements and different angles. Sometimes they follow different workflows. The point of all that difference is a real range of options. Asking one writer to polish one line five times gets you one idea in five outfits.

A rubric written first keeps the judge from grading on mood. Every option is scored on five criteria (idea, truth, craft, fit and range) from 1 to 5, and what a 5 and a 1 look like is written down before anyone sees a candidate. The scores sort the field into rough tiers. After that we let smart agents look at all of it and decide which ones they think are the best and why, and which are the worst and why. They write that up as a report. Part 6 covered the economics: cheap models do the wide, parallel part, and the smart models do the judging.
Copywriters didn't invent this shape. DeepMind's AlphaCode, published in Science in December 2022, wrote up to a million candidate programs for a single contest problem. Running each one against the problem's example tests threw out about 99 percent of them. The system then grouped the survivors and submitted at most ten. It finished around the level of the median human competitor on Codeforces, which no program had done before. A million tries went in and ten came out, and the judging decided the result.
We keep every losing version with the reason it lost. Every entry in that database carries the couple dozen properties from Part 5. So when the smarter agent puts together the top results, it also knows what to avoid, and why. The Onion's writers said the same about their rejects. A headline dies in their room when it isn't rooted in something true, when it's too close to a joke that's already out there, or when it comes at the subject from the wrong angle. That's a tag on a loser. Kept across every round, those tags teach the next round what not to repeat.

A tournament has one weakness. It can only pick the best of what the makers were able to imagine, and sixteen versions of a generic line are still sixteen generic lines. So what decides what the makers can imagine?
One world model can become any kind of media a studio makes
Two shops sit side by side on a street. One window shows a row of identical grey coats, and the other shows one coat cut to fit one person. The makers in both shops can sew. What's different is how much the second shop knows about the person the coat is for.
By media I mean every type of media a studio could be asked for. This article started at a cloud bill and went a long way down from there. The goal at the bottom is to make content at the scale of a studio director with decades of experience, who can take any request and turn it into the best media possible. That means any kind of media: Music. Photos. Videos. Short advertisements and long-form documentaries. An agent that converts prospects inside a chat room, or a voice agent that hops onto a Discord call. A stack of term sheets compared side by side, cash flow statements, business briefs, and the dozens of other corporate documents that make up an alphabet soup thick enough to make even NASA shift in its seat. Who does acronym soup better, the military or the government? Very tough decision.
Even Pixar starts with a version that doesn't work. A studio director with decades behind him sounds like one gifted person. Ed Catmull's book about Pixar, Creativity, Inc., which he wrote with Amy Wallace in 2014, tells a different story. On The Diane Rehm Show that year he put it flat: "the first versions of all of our films suck. And I don't mean this in a self-deprecating way." What fixes them is a group of peers he calls the Braintrust, filmmakers who tear into each other's cuts while the director keeps the final say. That's the tournament from the last chapter, run by people with Oscars. The famous name on the poster sits on top of a repeatable way of finding out what's wrong with a bad early version.
A world model is what makes the coat fit. Every environment in that list of media is its own world model, the way Dallas was in Part 5. A campaign is one. A term sheet negotiation is one. When the factory has no model of the person on the other end, it produces the grey coat, and the grey coat is AI slop. When it has their problem, what they want, what they believe and the reading level they're comfortable at, the same makers cut something that fits. One model can then be unfolded into an ad, a document or a spoken reply, which was the whole trick of Part 4. A piece that fits is one a person is glad they spent the time on.
A real funnel has upper dozens of steps and every one of them needs a piece made. That's where the volume comes from. A real funnel has dozens of steps, often close to a hundred, and every one of them needs its own piece. Google once published a count of this. In March 2016 Lisa Gevelber wrote up one car shopper, a 32-year-old mother of two called Stacy, using clickstream data from Luth Research. In the three months before she leased an SUV, Stacy had more than 900 digital interactions about the purchase. She ran 139 searches, and 71 percent of the interactions happened on her phone. Google's Zero Moment of Truth study in 2011 asked 5,000 shoppers the same kind of question and found the average buyer consulted 10.4 sources, up from 5.3 the year before. The slide in the meeting still says see, click, buy.
Finished work most often gets dropped in the last few steps. Every one of those steps is a piece with a value from the first chapter and a tournament from the second. The formula sounds impossible to follow. It's only a bit complicated, which is a different thing. The place it breaks in practice is the end. A line gets drafted, scored and approved, and then nobody carries it the last few steps to the person it was for. It's the easiest place to stop and call the work done.

That's a lot of machinery, and every piece of it runs on models somebody pays for by the month. So what did the money buy?
Most AI spending hasn't shown up on anyone's books yet
In 1987 the economist Robert Solow wrote a sentence that has been quoted ever since: "You can see the computer age everywhere but in the productivity statistics." A vice chair of the Federal Reserve quoted it again in a speech on 13 November 2026, a week before I wrote this. He was talking about AI.
Two large surveys found most firms can't show a return yet. PwC asked 4,454 chief executives in 95 countries between 30 September and 10 November 2025. More than half, 56 percent, said AI had brought them neither higher revenue nor lower costs, and 12 percent said it had brought both. McKinsey's State of AI survey from November 2025 found 39 percent of respondents could attribute any effect on company-wide earnings to AI, and most of those put it under 5 percent. I leave out the best-known number, the claim that 95 percent get zero return, because the MIT report behind it calls its own findings preliminary.
A fee turns into value when it comes out as work you'd otherwise have to buy. This is the holy grail of what companies are looking for. They want to substantiate an arguably excessive spend on AI, and they do it by converting thousands of dollars of subscription fees into tens of thousands of dollars of actual business value. Klarna made the public version of this claim on 28 May 2024. Its press release said sales and marketing spend fell 11 percent in the first quarter while it ran more campaigns, that AI accounted for 37 percent of the saving, or about $10 million a year, and that spending on outside marketing agencies was down 25 percent. Those are Klarna's own figures, and nobody outside has checked them. The shape is what I care about, because the money shows up as work the company no longer has to buy. In one client's case, the fees came back as nineteen finished films, the recipes for making more, and a searchable footage library. I should be plain about the dollar figure. Tens of thousands is my estimate of what that work would cost to buy from outside. Nobody has audited it.
I sort every claim about value into made, replaced and not measured. Think of three trays on a counter. The first tray holds what got made, and you can open it and look. The second holds what it replaced, which is either a purchase that didn't happen or hours somebody got back. The third tray is what I haven't measured yet, and it stays on the counter with a tag on it. For that client the films are in the first tray, and the revenue they bring in is in the third.
A flywheel starts with one turn somebody can see. The same technology does several jobs once it's running. It helps with lead generation. It makes content, which helps with conversions and profit. It helps with retention, because it lets you nurture a relationship and understand your customers better. I tie these together with what I call the value flywheel, and I owe the name to other people. David Anderson, Mark McCann and Michael O'Reilly wrote The Value Flywheel Effect in 2022, and their wheel has four phases: clarity of purpose, challenge, next best action and long-term value. They built on Jim Collins, whose Good to Great describes pushing a heavy wheel until its own weight carries it and says nobody can name the one big push that did it. My version of the first push is small, because I'm bootstrapping. I make one thing of immediate value for one audience I understand, and I put it in front of that audience. The recipe that made it makes the second one cheaper, and that's the wheel starting to carry its own weight.
Say the wheel turns. One customer is happy and the work is good. What happens when the guy who built it gets sick?
Firms that grow put their judgment in a system instead of a person
A small agency is a consultant with a few extra steps. I say this as one. Small agencies are typically a consultant with some buddies to support them, and the buck stops with that consultant. If they get overwhelmed, injured or sick, the clients aren't going to get the same quality from the team as from that core lead. That keeps small agencies small, and the count backs it up. The Census Bureau's County Business Patterns for 2023 lists 15,512 advertising agency offices with employees in the United States. About 68 percent of them have fewer than five people, and about 80 percent have fewer than ten. Michael Gerber said it to a pie-shop owner named Sarah in The E-Myth Revisited. If your business depends on you, he told her, you don't own a business. You have a job, "and it's the worst job in the world because you're working for a lunatic!" I've been the lunatic.
Big agencies get big for the same reason big hedge funds do. They have great systems, and the systems exist outside of any individual. The firm can lose anyone, at any level, and keep working, because the knowledge lives in the system. Look at the top quantitative hedge funds. No single strategy is generating their billions of dollars. Over the course of decades they've had some of the smartest people on the planet work together to add incremental pieces to a shared technology that exceeds every individual in the building. The absolute best agencies work the same way.
Renaissance put everyone on one model and paid them from one pot. Gregory Zuckerman's 2019 book The Man Who Solved the Market is the best account of this I've read. He reports that the Medallion fund at Renaissance Technologies averaged about 66 percent a year before fees and 39 percent after, from 1988 to 2018. Those are averages he reconstructed for a private fund, and nobody outside has audited them. The part I care about is how the place runs. Zuckerman describes code that any researcher can open and improve. Peter Brown, the chief executive, told a Goldman Sachs interviewer in 2023 that "we pay everyone from the same pot." Jim Simons stepped back from running the firm in 2010, and Zuckerman's table of returns keeps going for eight more years. Nobody at Renaissance is disposable: the average employee stays more than 14 years. The accurate claim is narrower. When someone leaves, the model stays.
Winning firms are obsessed with systems design. That narrower claim is still the whole lesson. If you want to be more like the winners of an ecosystem than the losers, you model yourself after the winners, and the winners here are unanimously obsessed with systems design. That's what the office in Part 6 is for: knowledge, operations, task scopes and templates all live outside any one head. My test is a sick day. If I'm out and the work comes back the same, the judgment has moved out of my head.
If the judgment lives in the system, and agents do more of the work in that system every year, where does this go?
A Japanese village built its floodgate 27 years before the wave came
Fudai is a fishing village on the northeast coast of Japan. Kotoku Wamura was its mayor for forty years, from 1947 to 1987. He had seen what the 1933 tsunami did, and the village record of the 1896 one put the water at 15.2 meters. So when the plan for a floodgate came in at the usual ten meters or so, he insisted on 15.5. Construction ran from 1972 to 1984 and cost 3.56 billion yen. People objected to the money and to the land it took. A monument beside the gate carries his answer, which was that a thing that had happened twice couldn't be allowed to happen a third time. He died in 1997. On 11 March 2011 the water came in at around 20 meters and went over the top of the gate. Even so, the gate kept the wave out of the village center, and no homes behind it were swept away. Fudai recorded no deaths and one person missing, a man who had gone out to check his boat. The Associated Press reporter Tomoko Hosaka wrote that May that villagers were visiting Wamura's grave. She also quoted what he told village staff when he retired: "Even if you encounter opposition, have conviction and finish what you start. In the end, people will understand."
I plan as if agents will be able to do the whole job. I think that if you want to build the best agent platforms, you have to think at a post-AGI scale. It isn't a question of whether, only when. I can't give you the date, and I'd be wary of anyone who does. That part is my bet, and you should hold it as one. Since we know something is coming, though, we might as well plan for it. Why would you wait until the tsunami is on its way to start building your defenses? The good news is that this particular wall pays for itself in the meantime, because everything I've described runs on the models that exist today.
Every digital job has a workflow, so the question is which problems are worth it. Part 6 walked the ladder from a team's roles down to workflows that agents can run. Every digital task has one. The open question is how much of the market this reaches, and I think it's a large share. My evidence so far is one paying customer. That's a start. I wouldn't call it proof, and the next step is to keep iterating on the pattern with more of them.
I'm giving the pattern away because knowing it exists was never the hard part. None of this is proprietary in the sense that only I can do it. It's a pattern, and Part 2 said a pattern is different from a piece of software you copy and paste. What data models you use and which automations you put first depend on you and your business. What's rare is a roadmap for putting it all together, so take the pattern and use it. The world would be a better place if more people applied this.
One line on a bill was the snake in the grass. This whole thing started with a cloud bill, so here's that bill one more time. One paid minute of that video library costs about 6.1 to 6.8 times more to deliver from Convex than at Mux's 1080p rate, and Mux gives away 100,000 delivered minutes a month. At 25 people on typical use, the difference is about two dollars a month. It only gets large with thousands of heavy viewers. Those figures are modelled from rate cards, as Part 1 said. On this bill it was a small snake. My mentor's advice was to get an estimate of how many snakes are in the grass before you go rolling around in it, and one person with a lantern can only cover so much field. The factory is how I count them now. Every job leaves a record, and the next strange line on a bill gets found whether or not I remembered to look.

The companion piece is the video playback case study. It prices the same move for a team of 10 to 25 people, for 25 to 250, and for a platform of more than 250, with every assumption shown. Find the row closest to your own headcount. Then open your own bill and look for a line nobody on your team can explain.